The 2024 tornado season has been the most active to date since 2011. Even though the year started slightly below average compared to normal, the skies have more than made up for that in the past two months.
Interactive map credit: Baron Meteorologist and GIS Analyst Kristie Oldaker.
As of May 30, there have been 1072 preliminary tornado sightings, 3349 large hail accounts, and 6183 reports of wind damage. These three metrics are trending well above the mean since 2010, with wind damage reports pacing nearly twice as high. Ironically, they were all also near normal as recently as late April.
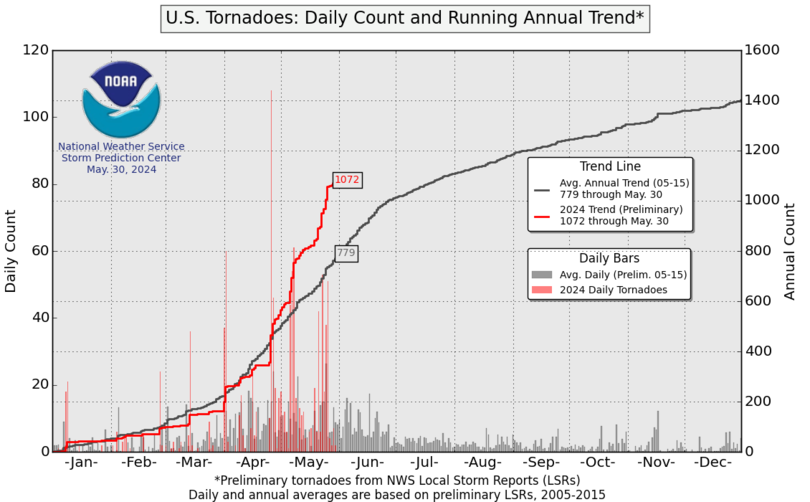
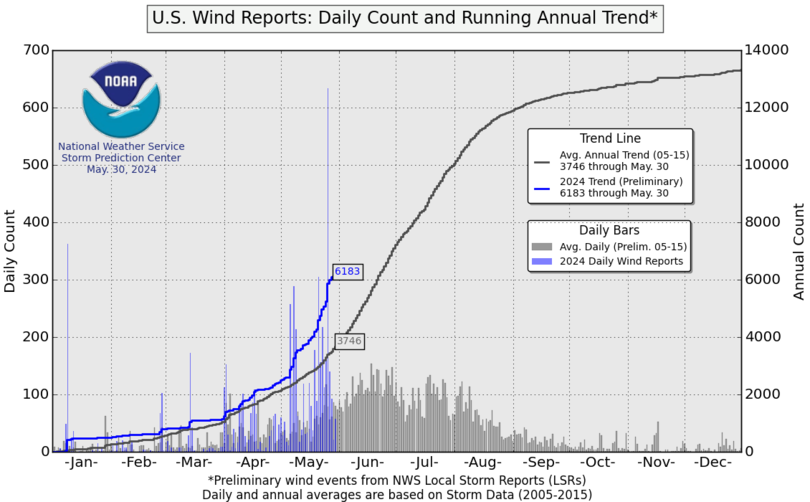


The graphs above were provided by the Storm Prediction Center as of May 30, 2024.
This year's overall distribution of severe thunderstorm activity has largely matched with climatology. Late-winter storms emerging along the Gulf Coast, a shift north into the Tennessee and Ohio River valleys by spring, and more recent outbreaks across the Great Plains are all consistent with typical spring synoptic weather patterns.
However, a few notable exceptions exist where tornadoes have hit areas with typically low probabilities for the time of year.
In late February, a cluster of tornadoes hit parts of Ohio and Michigan, where they rarely occur in the winter months. This was followed by another flurry of tornadoes in early March that produced extensive damage from central Ohio to West Virginia.
The most astounding tornado anomaly this season has occurred in western Pennsylvania, where 14 were reported in May alone. The 25-year monthly average across the entire Keystone State is only four.
While there have been several local severe weather anomalies so far in 2024, the collective volume and magnitude of the reports are also trending well above normal so far. Baron Weather GIS analysts and meteorologists will update this story as new trends emerge through the summer and fall months.
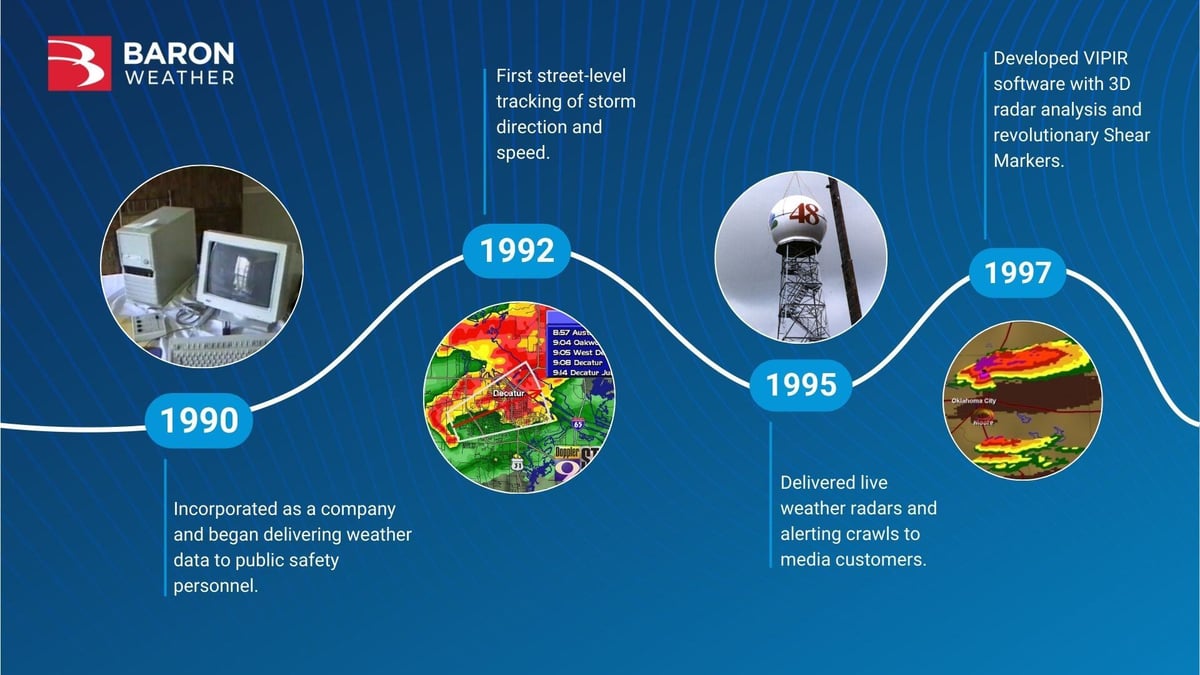
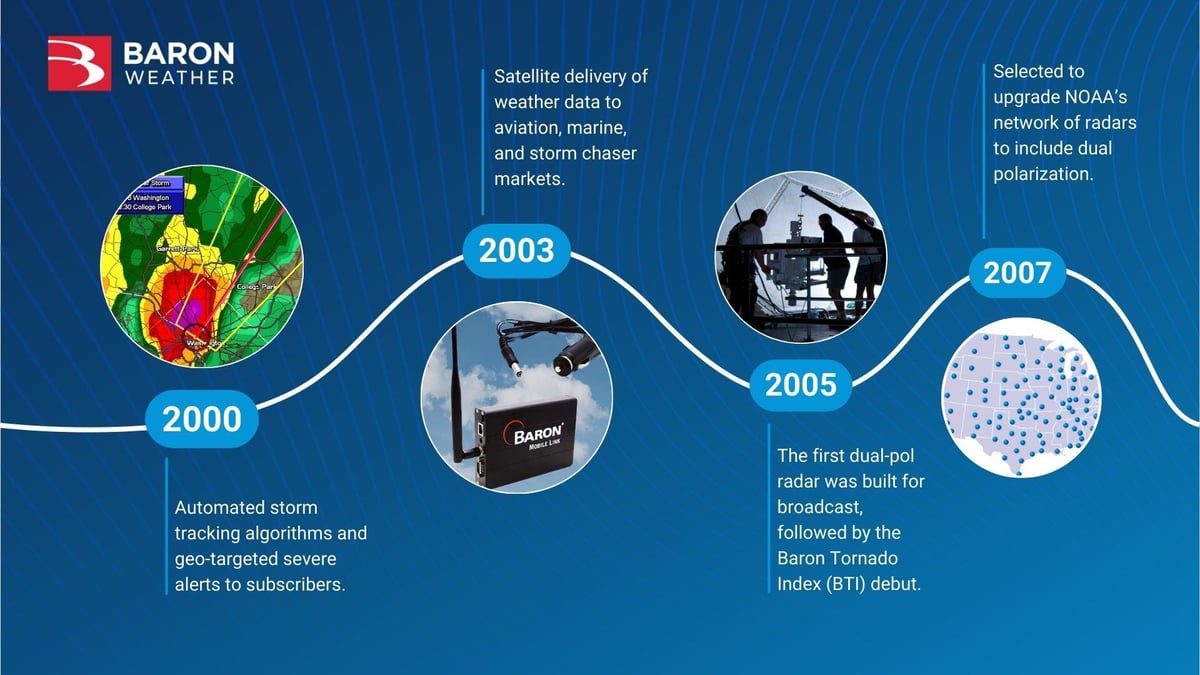
Tracking and predicting every weather peril is now easier, thanks to Baron’s 35-year history of innovation. What started as the first-of-its-kind arrival times for a thunderstorm has blossomed to include cutting-edge datasets for anything from hurricanes to heat waves. And when quality data wasn’t freely available, Baron either built the hardware to send it or engineered a way to deliver it.
Here are a few examples of how Baron has been an industry leader in solving weather challenges with technology, hardware, and software for over three decades.


The meteorologists and developers at Baron Weather have produced datasets that can be used “out of the box” with little effort for businesses that may not have a GIS team. However, they also have experts willing to listen to your team’s needs for a customized solution that can be fully integrated into your business systems and experiences.
When you choose Baron Weather, you’re choosing a company backed by science, proven for decades, and driven with a pure motive to keep your people, property, and business safe and productive.
