With almost 70,000 farms and ranches, agriculture in California is a $49-billion-dollar industry generating at least $100 billion in related economic activity. California’s economy is the fifth largest in the world, as more than a third of America’s vegetables and nearly three-quarters of our country’s fruits/nuts are grown in the state.
So, it’s no surprise that the state’s agricultural sector consumes about 40% of California’s water. Yet, the exact proportion of water needed for crop growth can vacillate, hinging upon precipitation amounts for any given year. Water usage must be strategic. When livelihoods, agricultural outcomes, and appetites are on the line, some organizations turn to the California Annual Precipitation (CAP) report powered by Weather Tools, Inc. to maximize water conservation while realizing financial and operational gains.
What is the CAP Report?
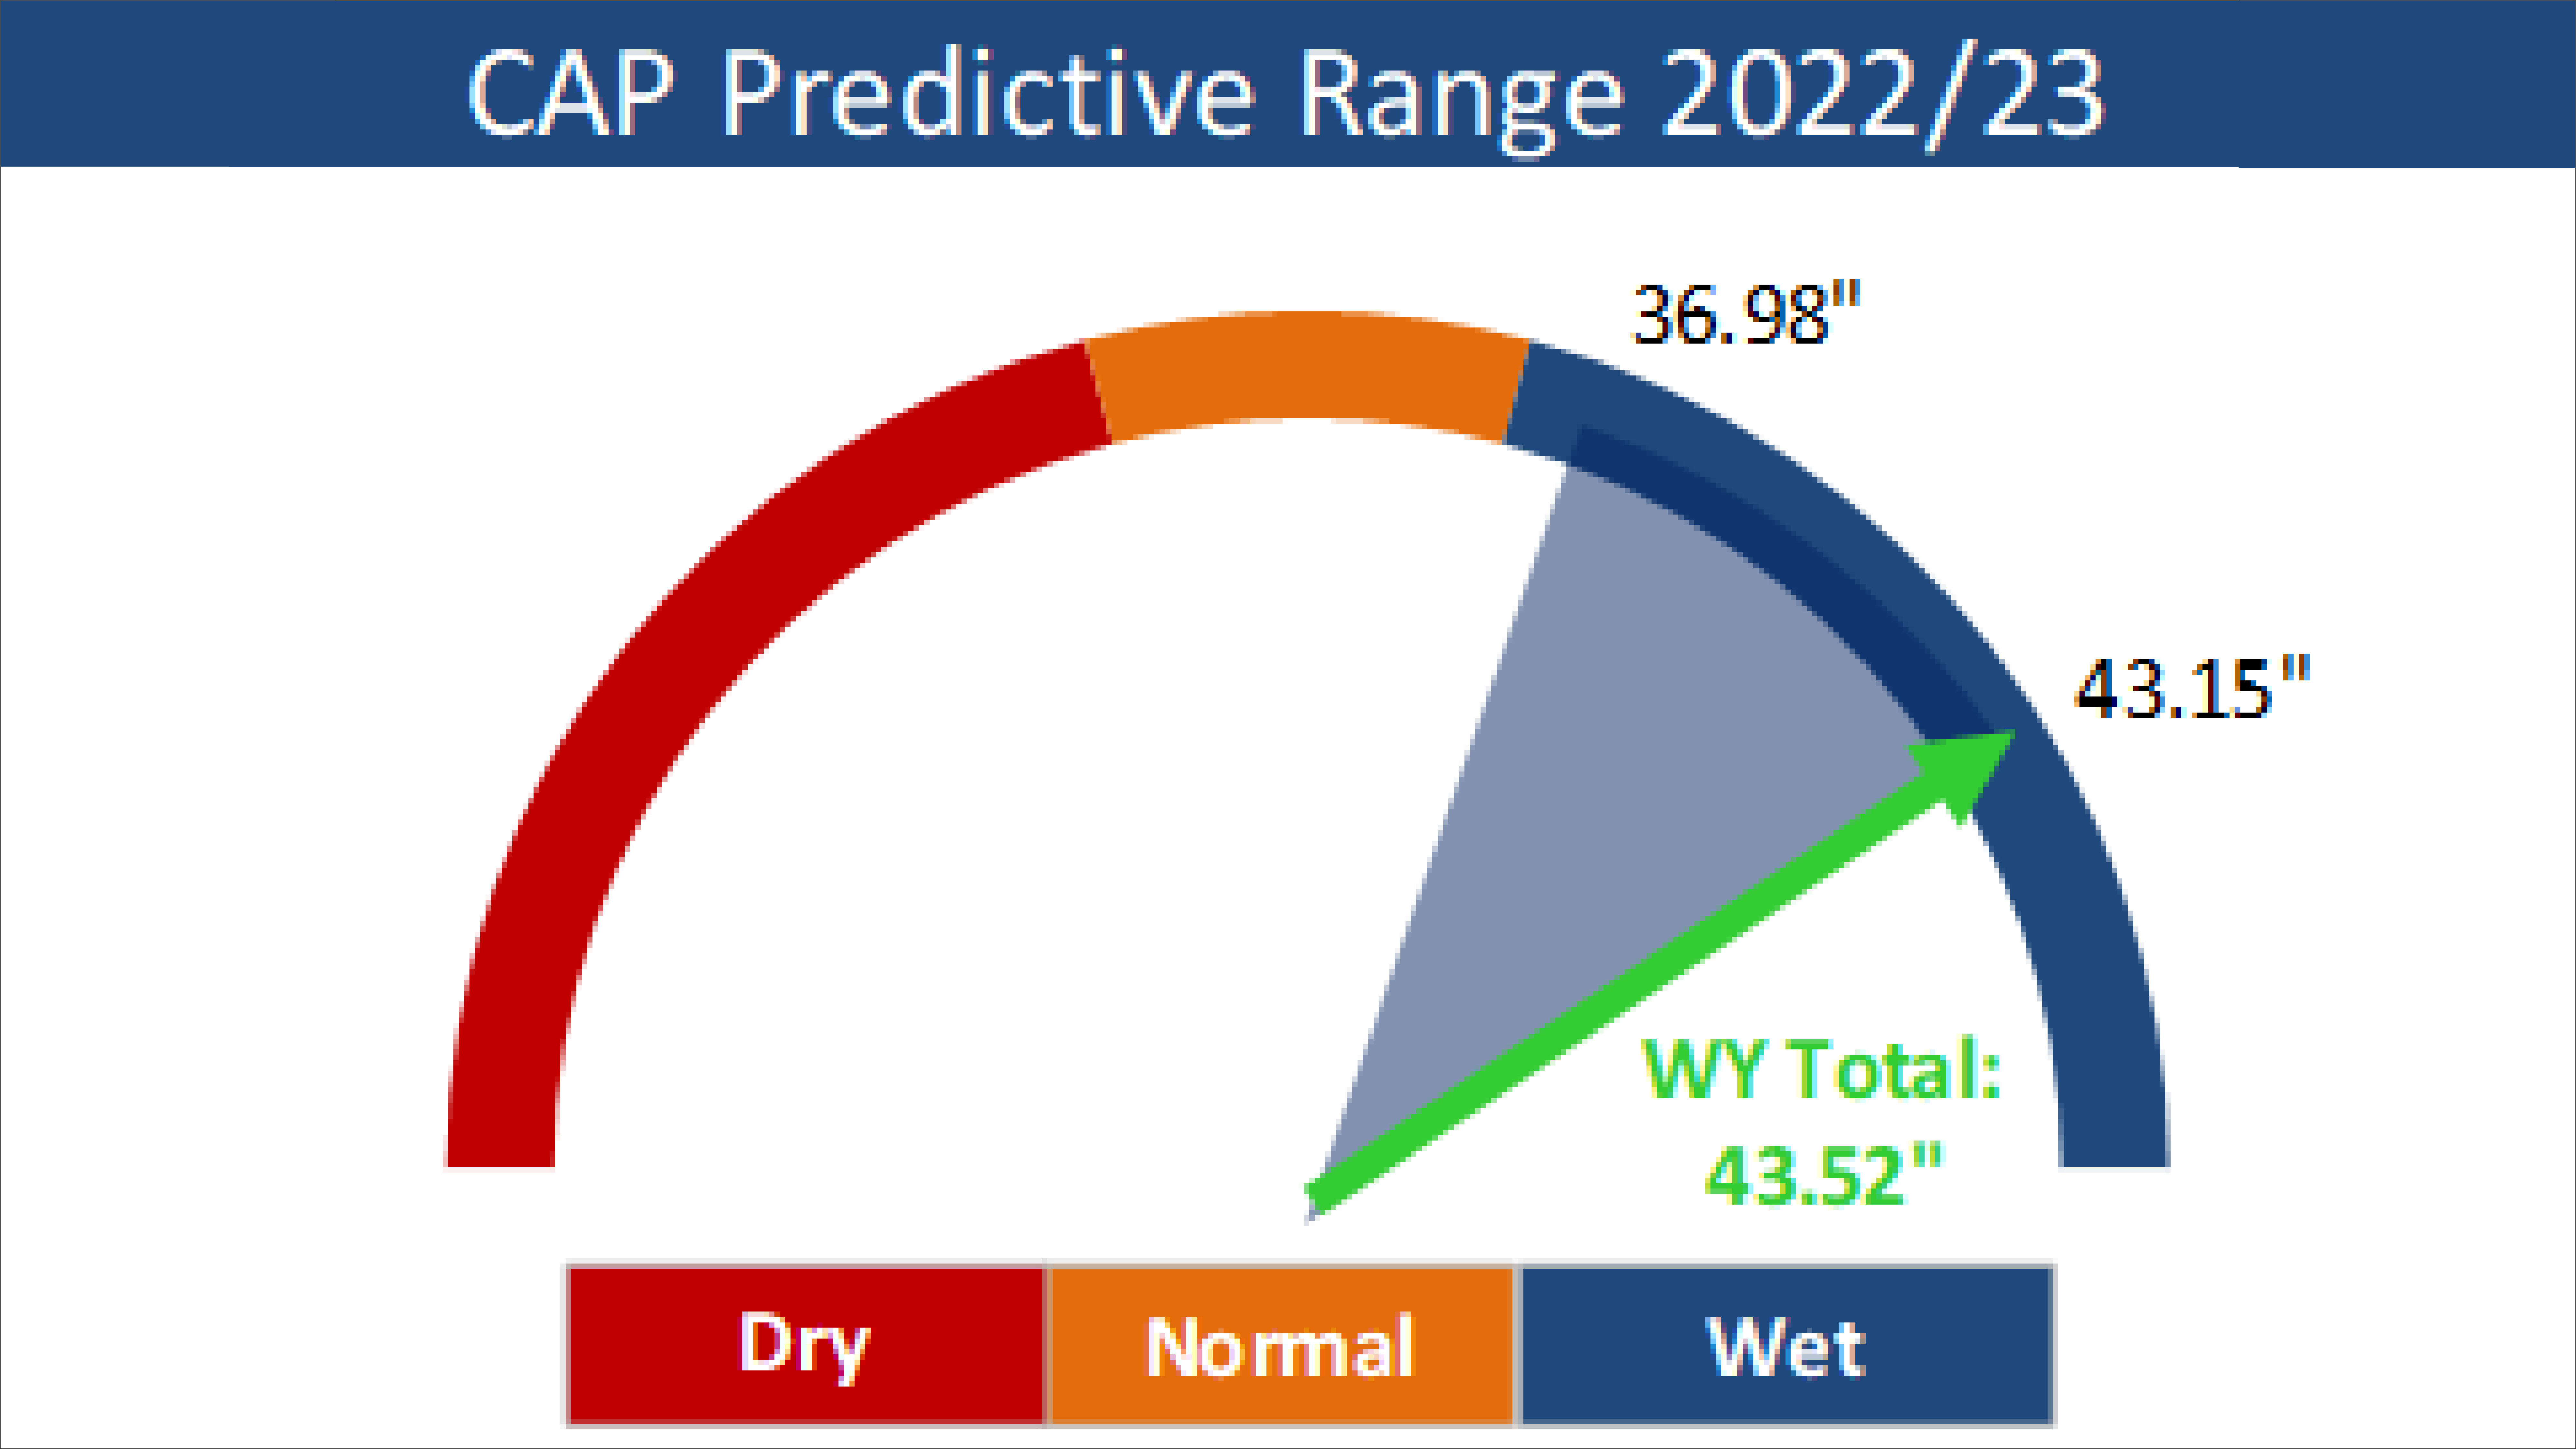
The California Annual Precipitation (CAP) report offers an accurate seasonal precipitation forecast for farmers and other professionals who maneuver tricky precip-related scenarios. The information is issued during the first week of November and forecasts the total precipitation for California’s water year (Oct 1-Sept 30) – almost a full year in advance.
“The water year is a data-reporting construct that aligns with the active precipitation window of California’s Mediterranean climate,” said Rob Doornbos, founder and CEO of Weather Tools. “It provides a data set used throughout California’s water management enterprise for reservoir operations, public safety, and many other water supply applications.”
Doornbos spent the early years of his meteorology career focusing on precipitation forecasting and associated technology development. He began applying this expertise to managing the family rice operation in Northern California.
As a farmer, Doornbos has seen his operations impacted by this water-year precipitation forecast.
“For me, this forecast has successfully informed crop insurance purchases, crop variety choices when planting, capital expense purchases, and income/tax planning (deferment),” he shared. “It is a key operational planning tool for Tendoor Farms.”
How It Works
The CAP report uses a statistical model which provides two critical pieces of information. The first essential element is whether it will be an above-normal (AB) or below-normal (BN) water year. Second, the report provides a definitive range of precipitation amounts, in 20% ranges relative to normal. These ranges are:

- 40% BN
- 20-40%
- 0-20% BN
- 0-20% AN
- 20-40% AN
- 40% AN
“Once the data is analyzed and predictions are made for the water year, the forecast does not change,” said Doornbos, who established Weather Tools in 2013. “Customers aren’t left chasing a fluctuating prediction but can make informed, water-related decisions months in advance.” In addition to the water year precipitation forecast, customers receive monthly progress reports on how the year unfolds.
“This includes an update on precipitation received using National Weather Service data, a meteorological comparison with similar water years, inferences on precipitation patterns and timing, and reservoir status,” he said. “While the forecast is valid for the state of California, it can be further regionalized to meet a customer’s specific operational needs.
Agriculture in California: Measuring Precipitation
The Weather Tools CAP forecasts have been verified every year since its initial report in 2017. Weather Tool’s mean absolute error has been 4.3% in extreme drought and abundant precipitation — which is no small feat.
“No other California precipitation forecast has come close to doing the same,” he said. “We constantly examine our model in the context of current water year precipitation, searching for anomalies or outliers that would enable us to make even the smallest adjustment to our technique.”
CAP Report & NOAA’s Seasonal Outlooks: The Difference
The CAP report and NOAA‘s seasonal outlooks are very different from each other, according to Doornbos. Whereas the Climate Prediction Center outlooks are probabilistic and give a wide range of possible outcomes, the content is often so broad that any helpful information is obscured.
“Our forecast is purely deterministic,” he said. “It gives one definitive range of expected precipitation, and we do not stray from that. The Climate Prediction Center’s (CPC) outlooks also get updated throughout the water year, while ours’ do not.”
Is that bold? Yes, but rightly so.
“I realize that sounds audacious, but it is born out of the nature of our technique,” Doornbos said. “Besides, the technique has produced forecasts that have been correct seven years in a row. CPC products don’t have that level of performance.”
Maximize Planning and Operations in 2024

Utilizing the CAP Report and Baron Threat Net can empower water and agricultural professionals to optimize site-specific weather intelligence around precipitation-related scenarios. Used in tandem, you get a powerful, robust tool that enables you to make informed decisions with clarity and confidence while realizing financial and operational gains.
The upcoming 2023-24 forecast will be released in November. Don’t let weather extremes compromise your profitability, productivity, reputation, and safety any longer!
