As we head into the heart of hurricane season, we want to help you produce the most accurate and engaging tropical forecasts. This video will walk you through telling the complete story of a tropical event using the tools and data available in Baron Lynx. Below, you will also find a list and description of some of the most valuable products for building a captivating tropical forecast.
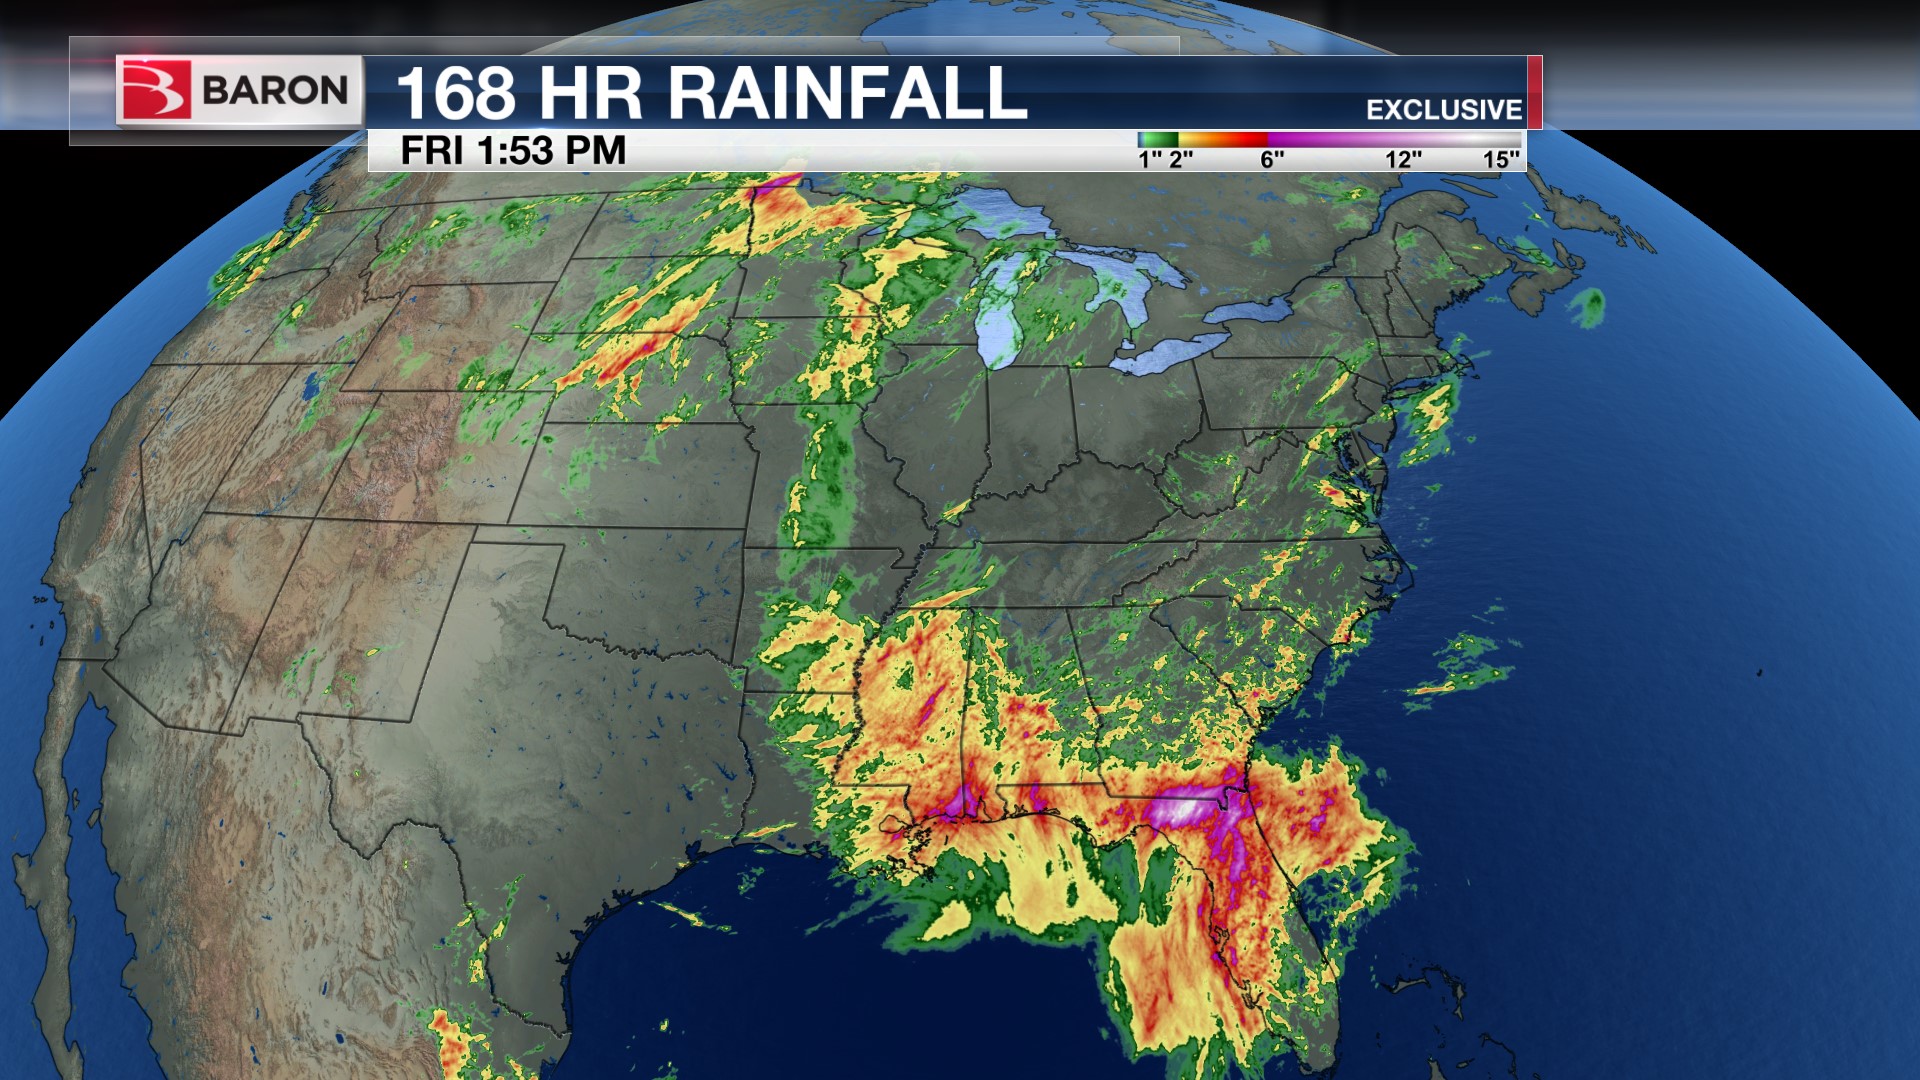
Extended Rainfall Accumulations (2, 3, 5, and 7-Day)
To go along with our 1,2,3,6,12 and 24-hour Rainfall Accumulations, Baron now offers new and exclusive Rainfall Accumulations from up to the past 7 days. These products will capture the entire lifecycle of a landfalling tropical system, whether it sits for days over the coast, or moves inland, creating flooding rainfall.
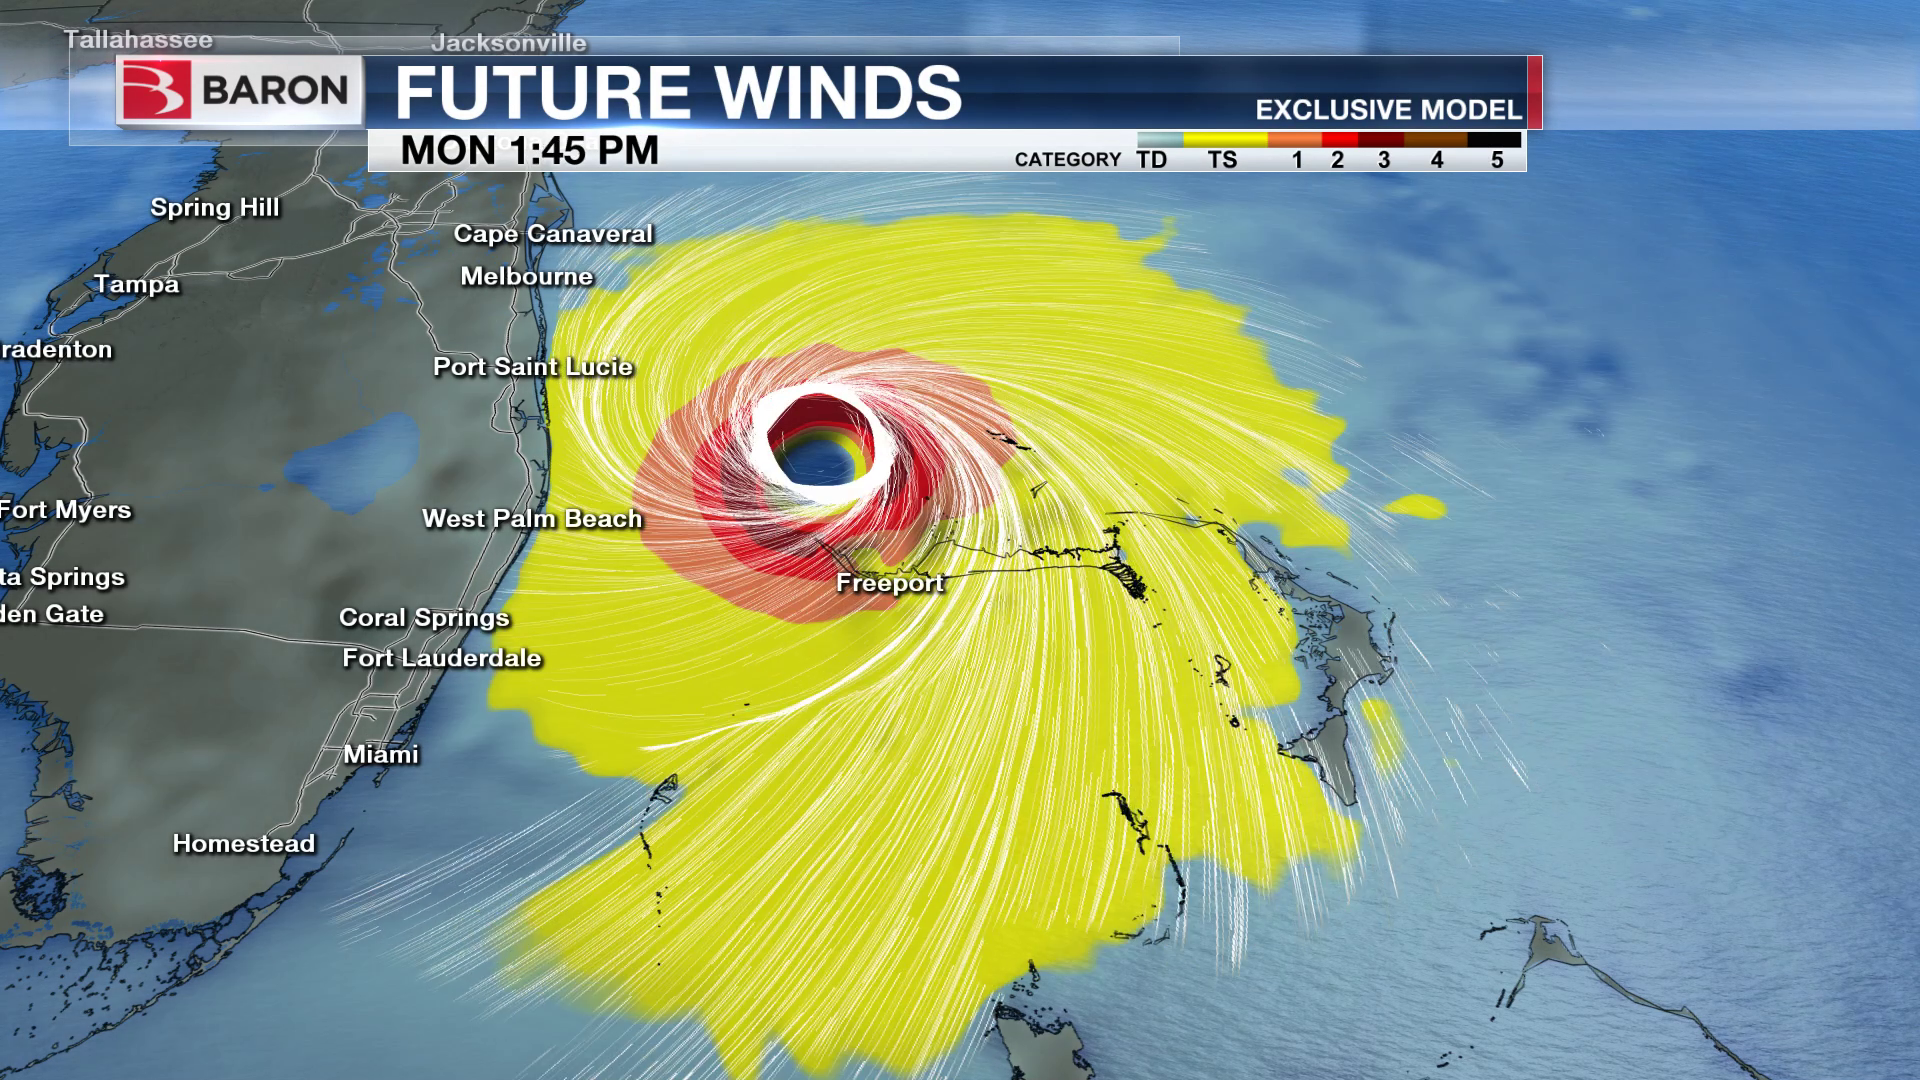
Forecast Winds/Gusts/Streamlines with Tropical Palette
Forecast model Wind Speeds, Gusts, and Streamlines effectively show the potential impacts of an impending tropical system. Palettes that colorize the wind speeds based on the Saffir-Simpson scale allow you to easily show what category strength the model forecasts.
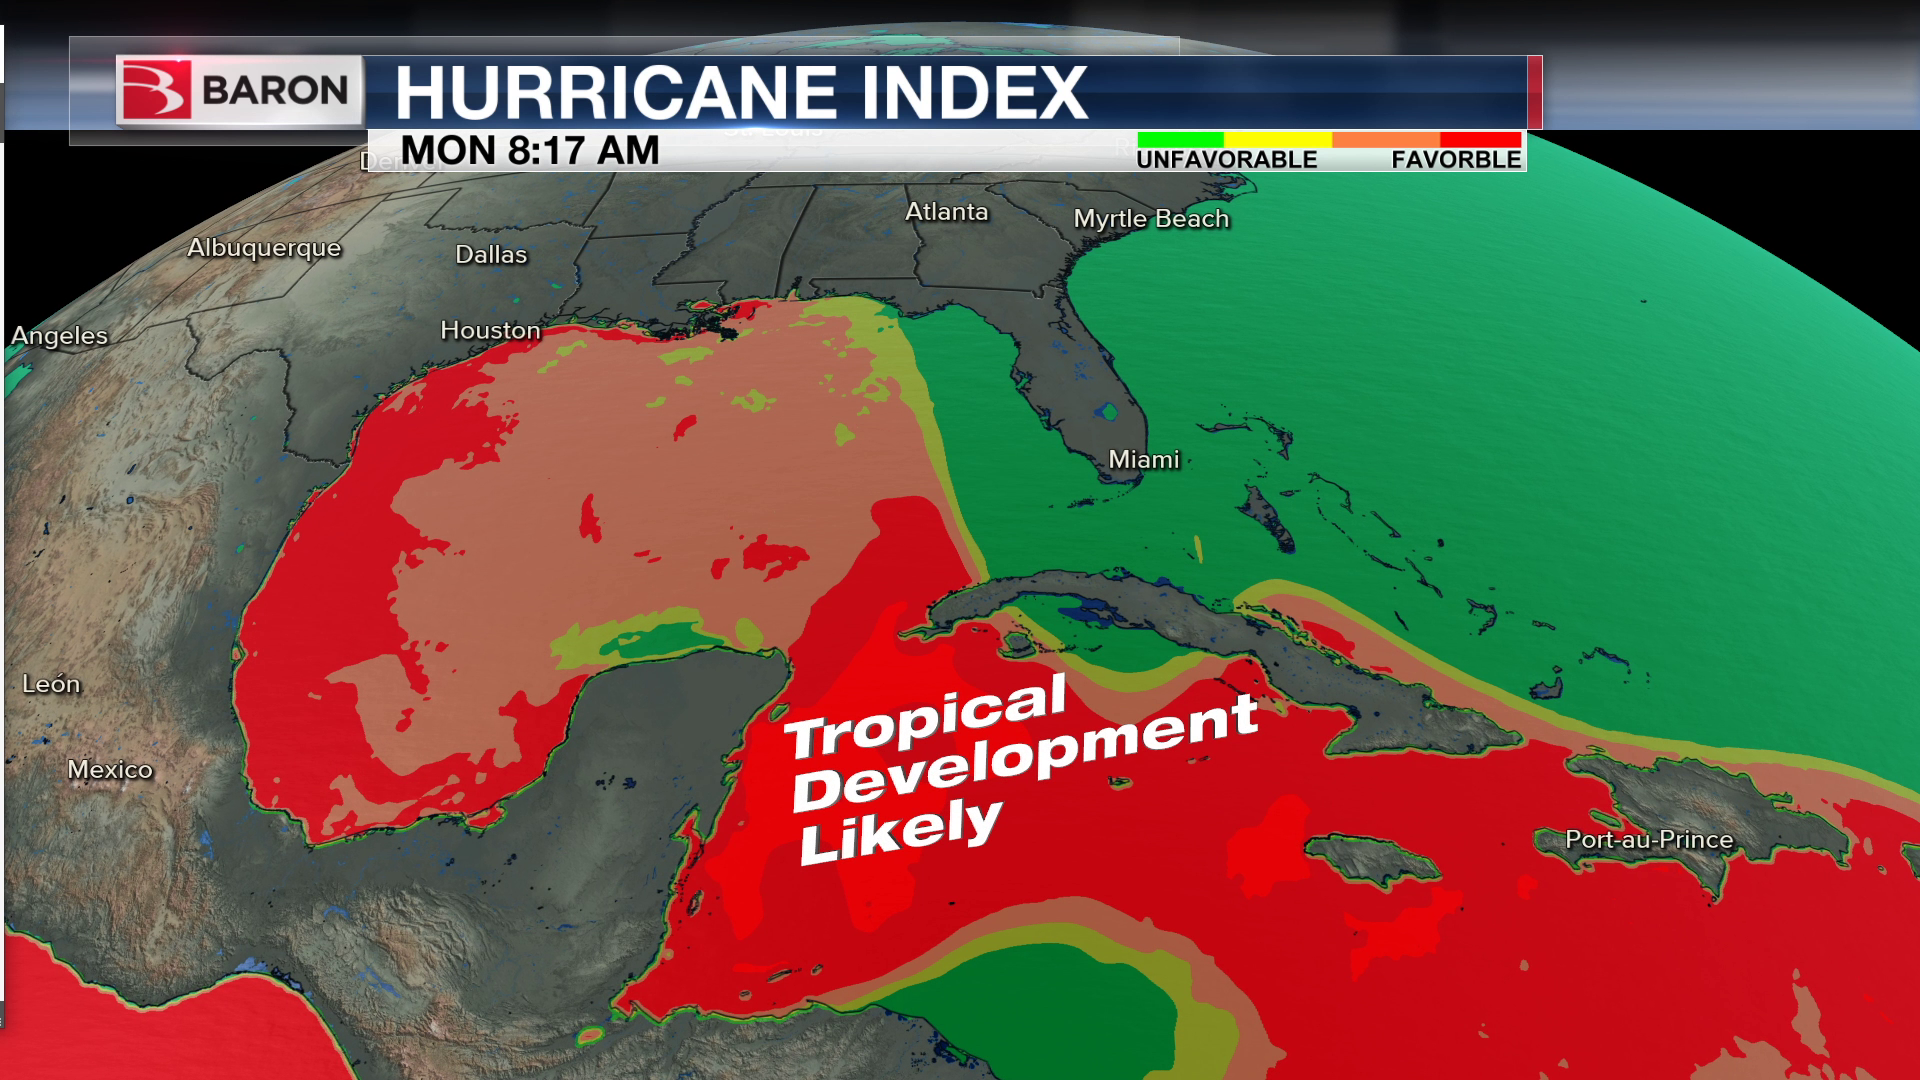
Baron Hurricane Index
The exclusive Baron Hurricane Index (BHI) forecast model takes into account many of the primary factors that lead to tropical cyclone intensification or weakening, including wind shear, sea surface temperatures, available moisture, and more. This allows you to show areas where an existing system may be able to intensify or weaken given the environment it is in.
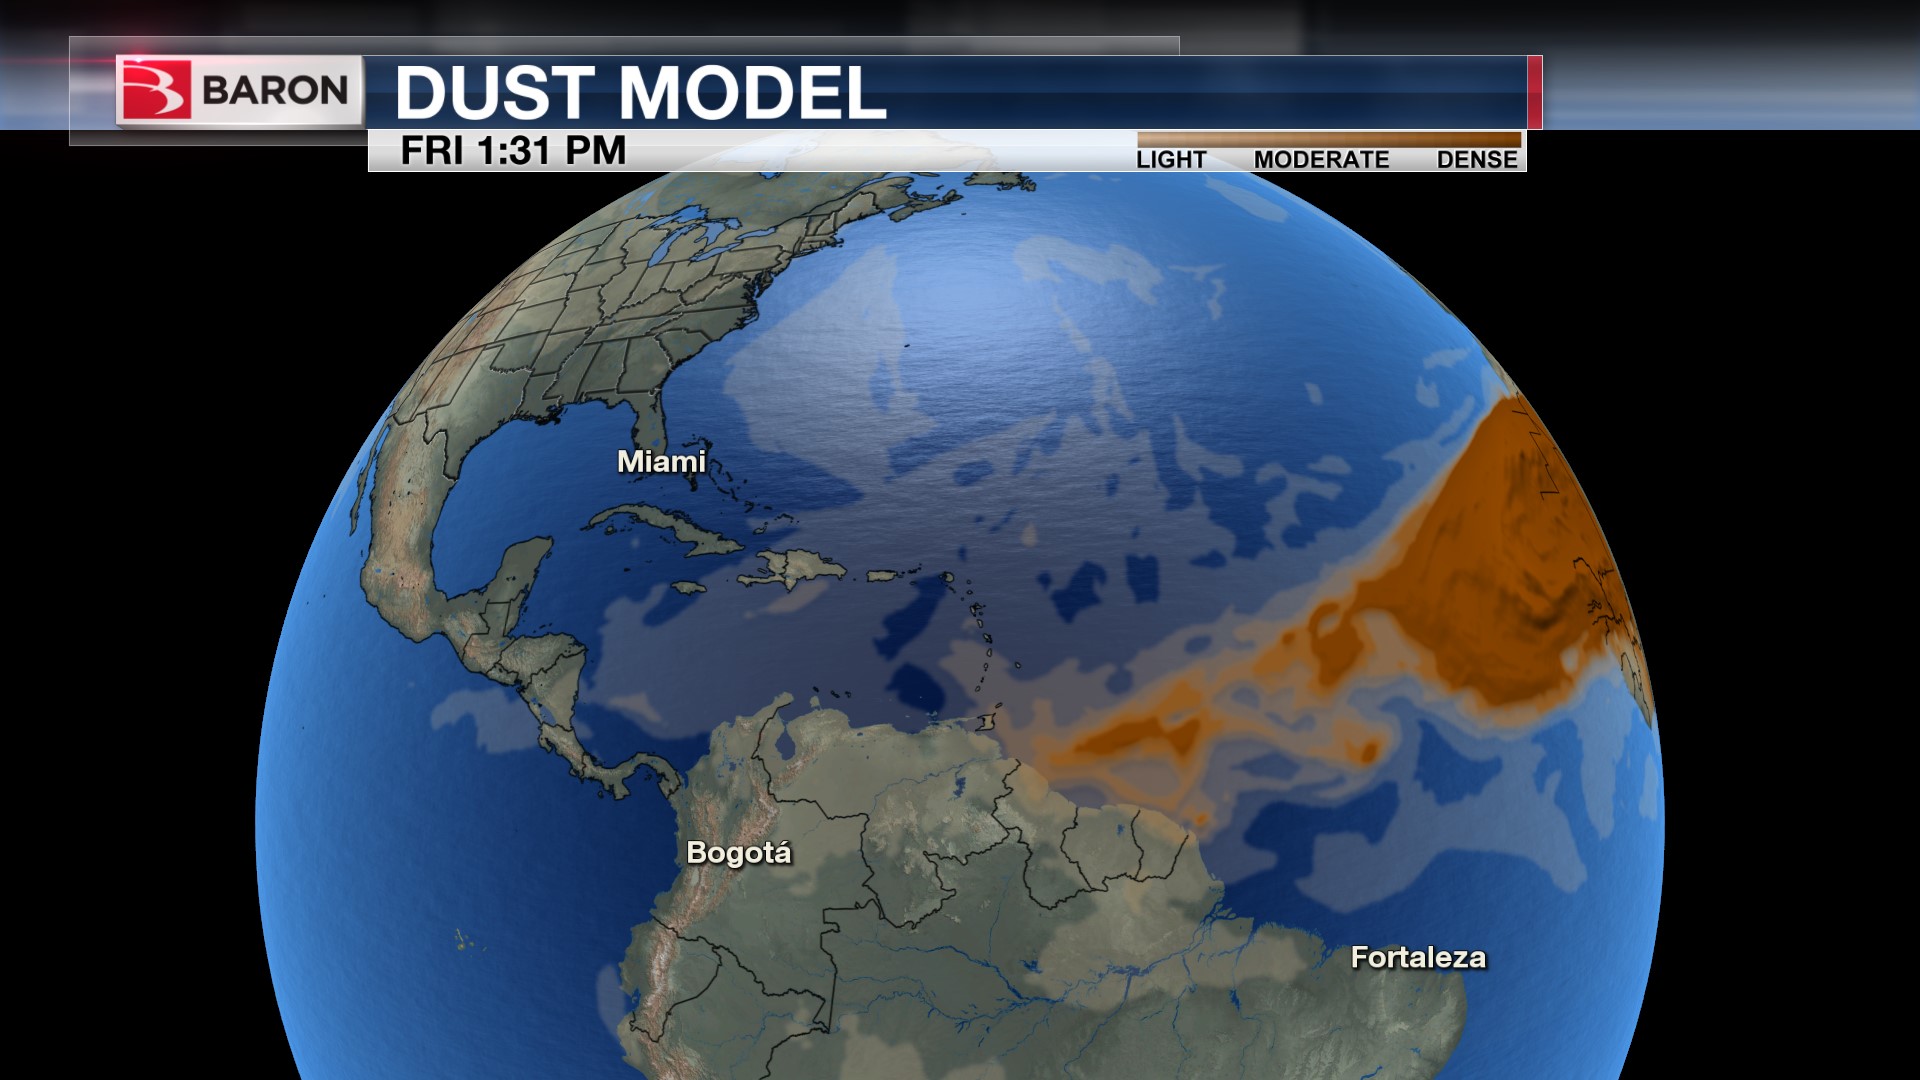
Current and Forecast Dust
We provide both Current and Forecast Dust products, primarily of the transport of dust off the coast of Africa. This is useful to track areas where dust in the atmosphere may inhibit tropical cyclone development.
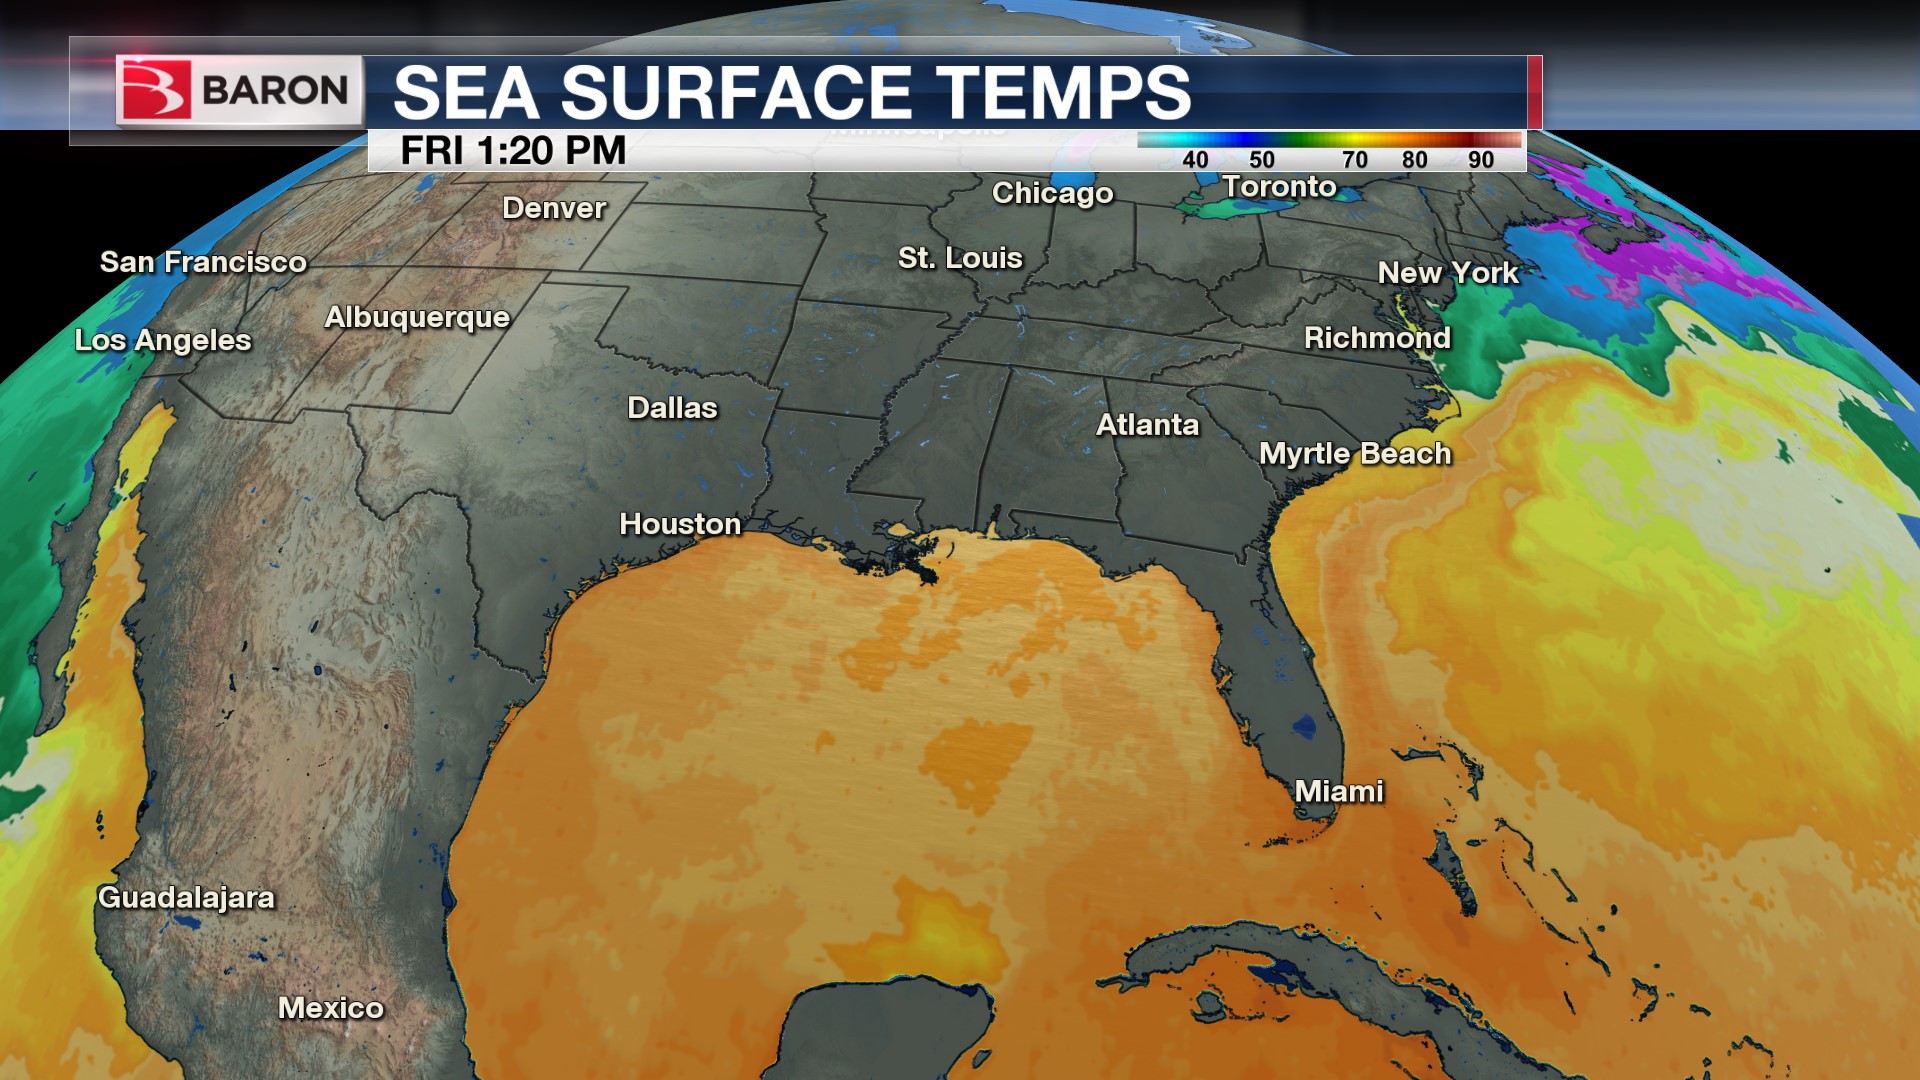
Sea Surface Temperatures
Current Sea Surface Temperatures are helpful in pinpointing where the warmest water, which aides in tropical cyclone intensification, is located.
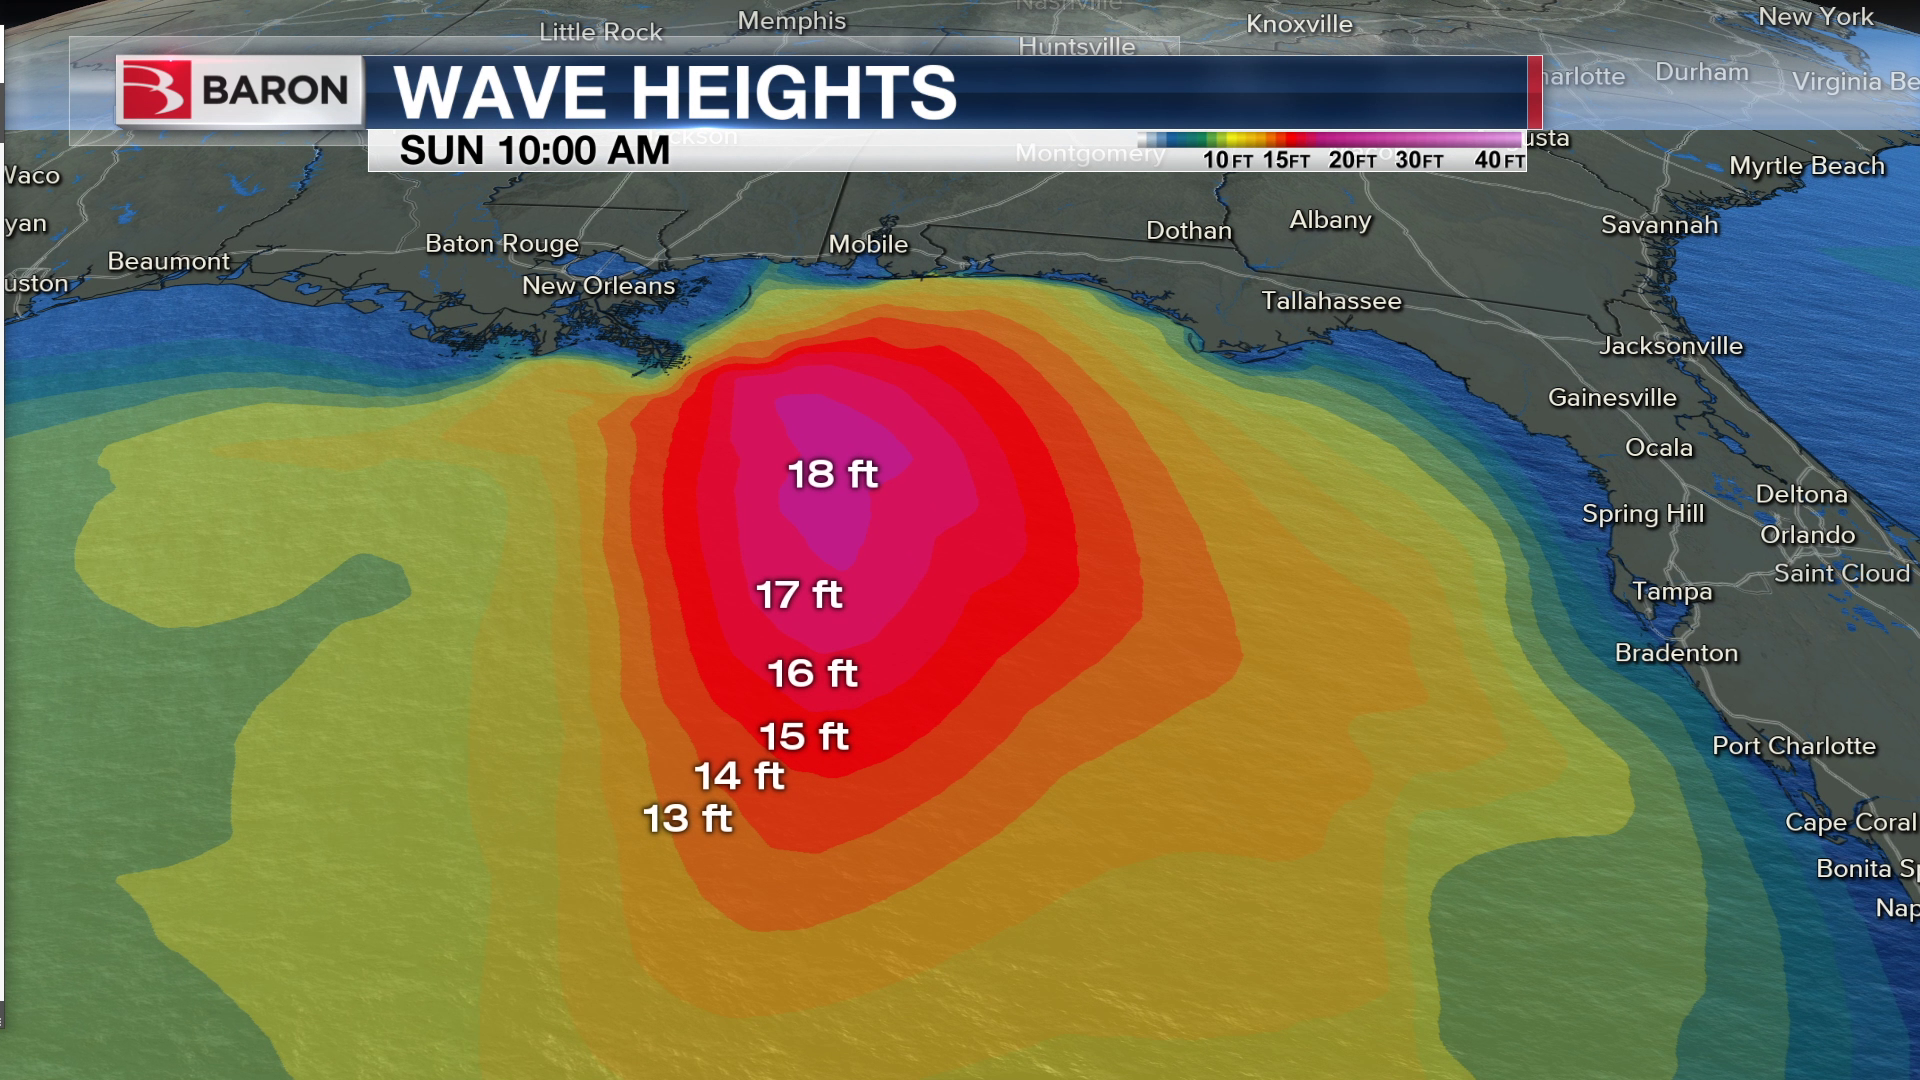
Wave Heights
Current Wave Heights are a useful tool to add to your tropical story. This product will show where large waves are being kicked up due to a nearby tropical system.
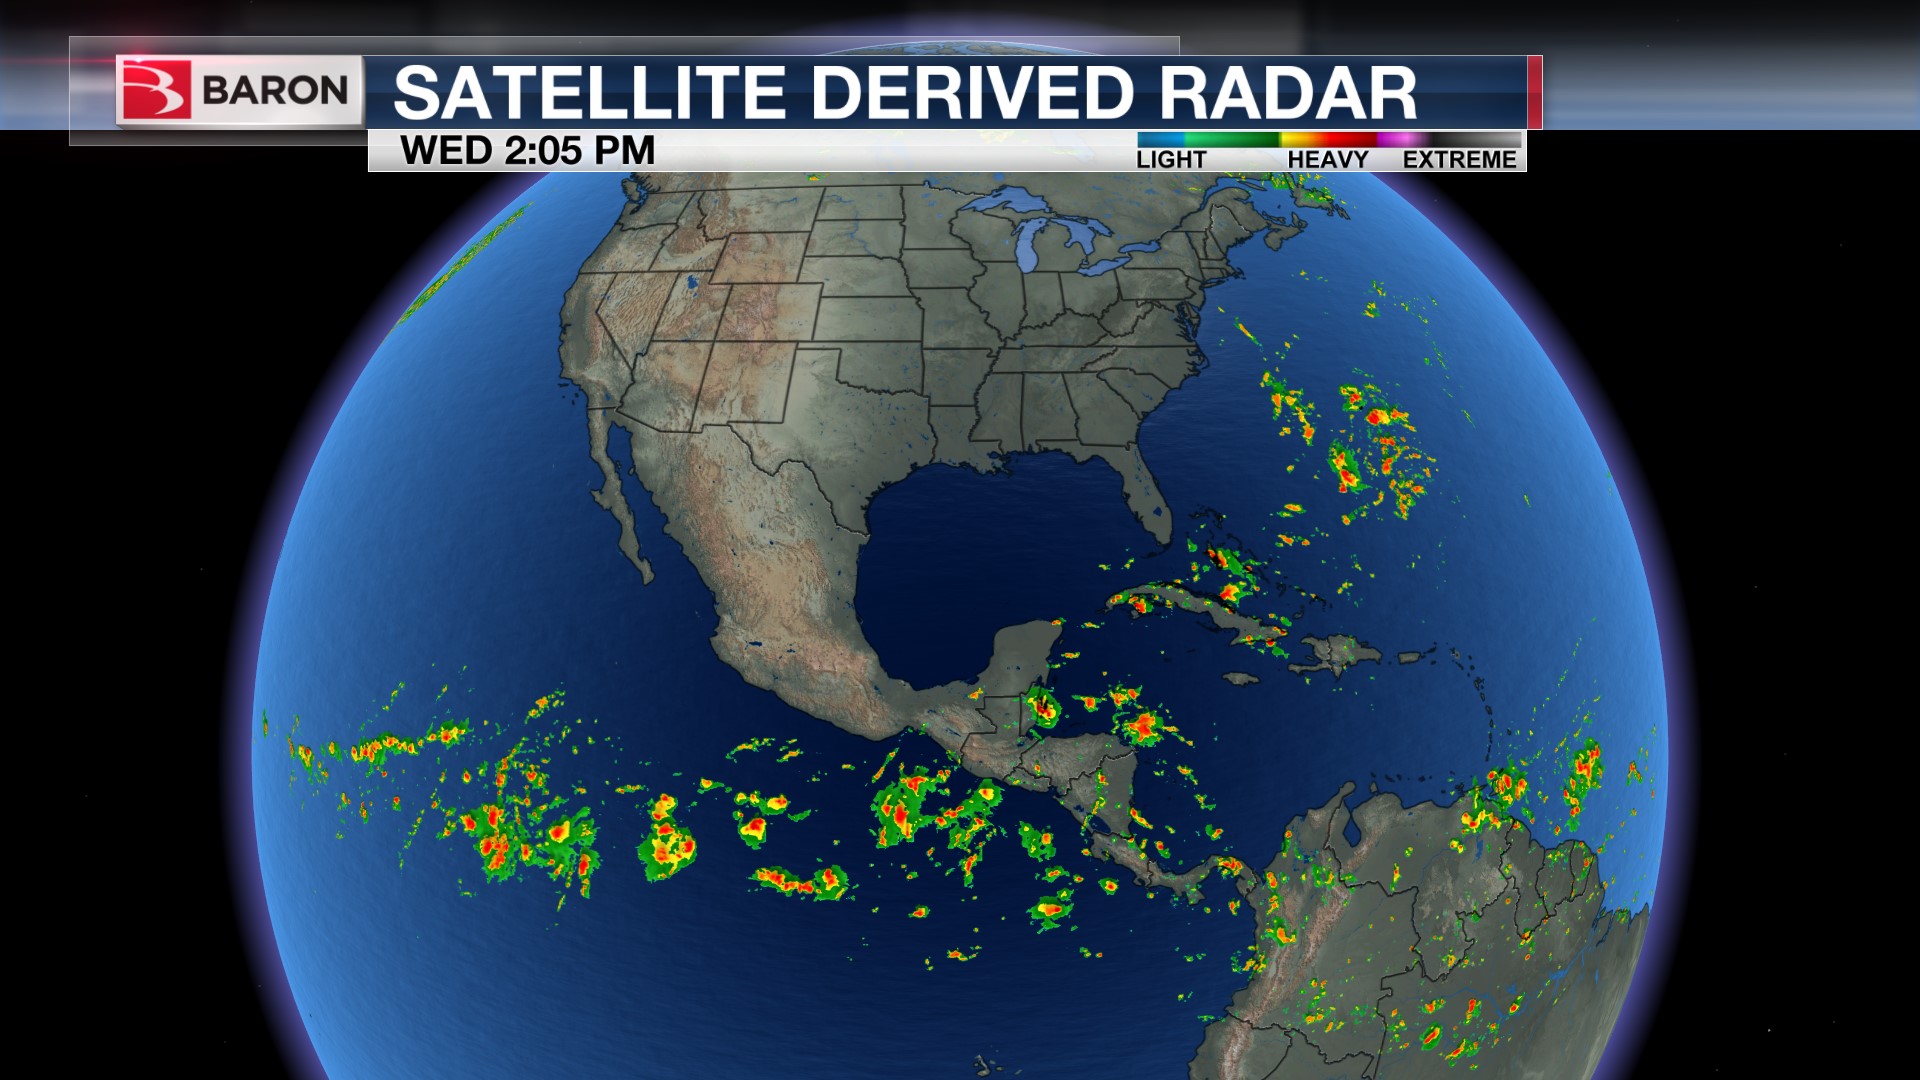
Global Satellite-Derived Reflectivity
Our exclusive Global Satellite-Derived Reflectivity product allows you to show a radar representation of any tropical cyclone around the world. This is driven by Baron science that derives a reflectivity depiction from global satellite data.
GOES16/17/Full Disk/Dual Disk Satellite
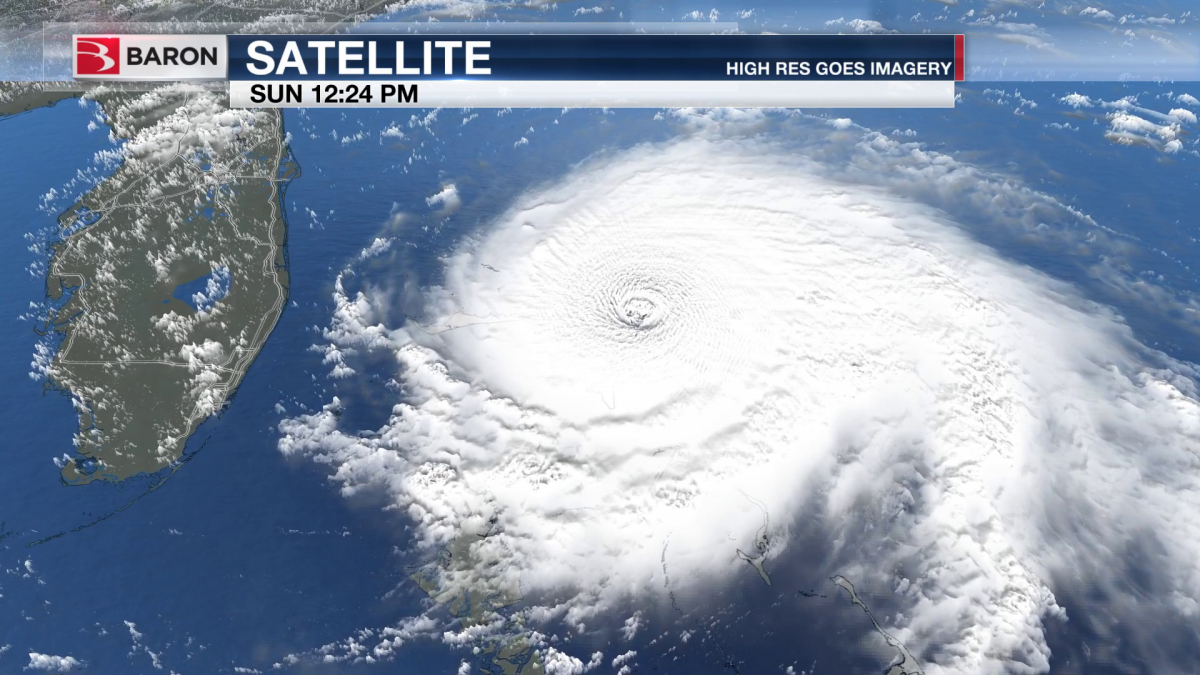
Our extensive lineup of products from GOES 16 and GOES 17 allows you to show high-resolution satellite imagery across nearly the entire Atlantic and Pacific. Use the GOES 16 grid to cover tropical systems in the Gulf and western Caribbean. GOES 17 will allow you to track cyclones all the way to Hawaii, and our Dual Disk products, which combine both GOES 16 and GOES 17, provide you a view of the entire Atlantic and Pacific basins. Don’t forget about the 1/2km Meso sectors for an ultra-high resolution depiction of tropical systems when available.
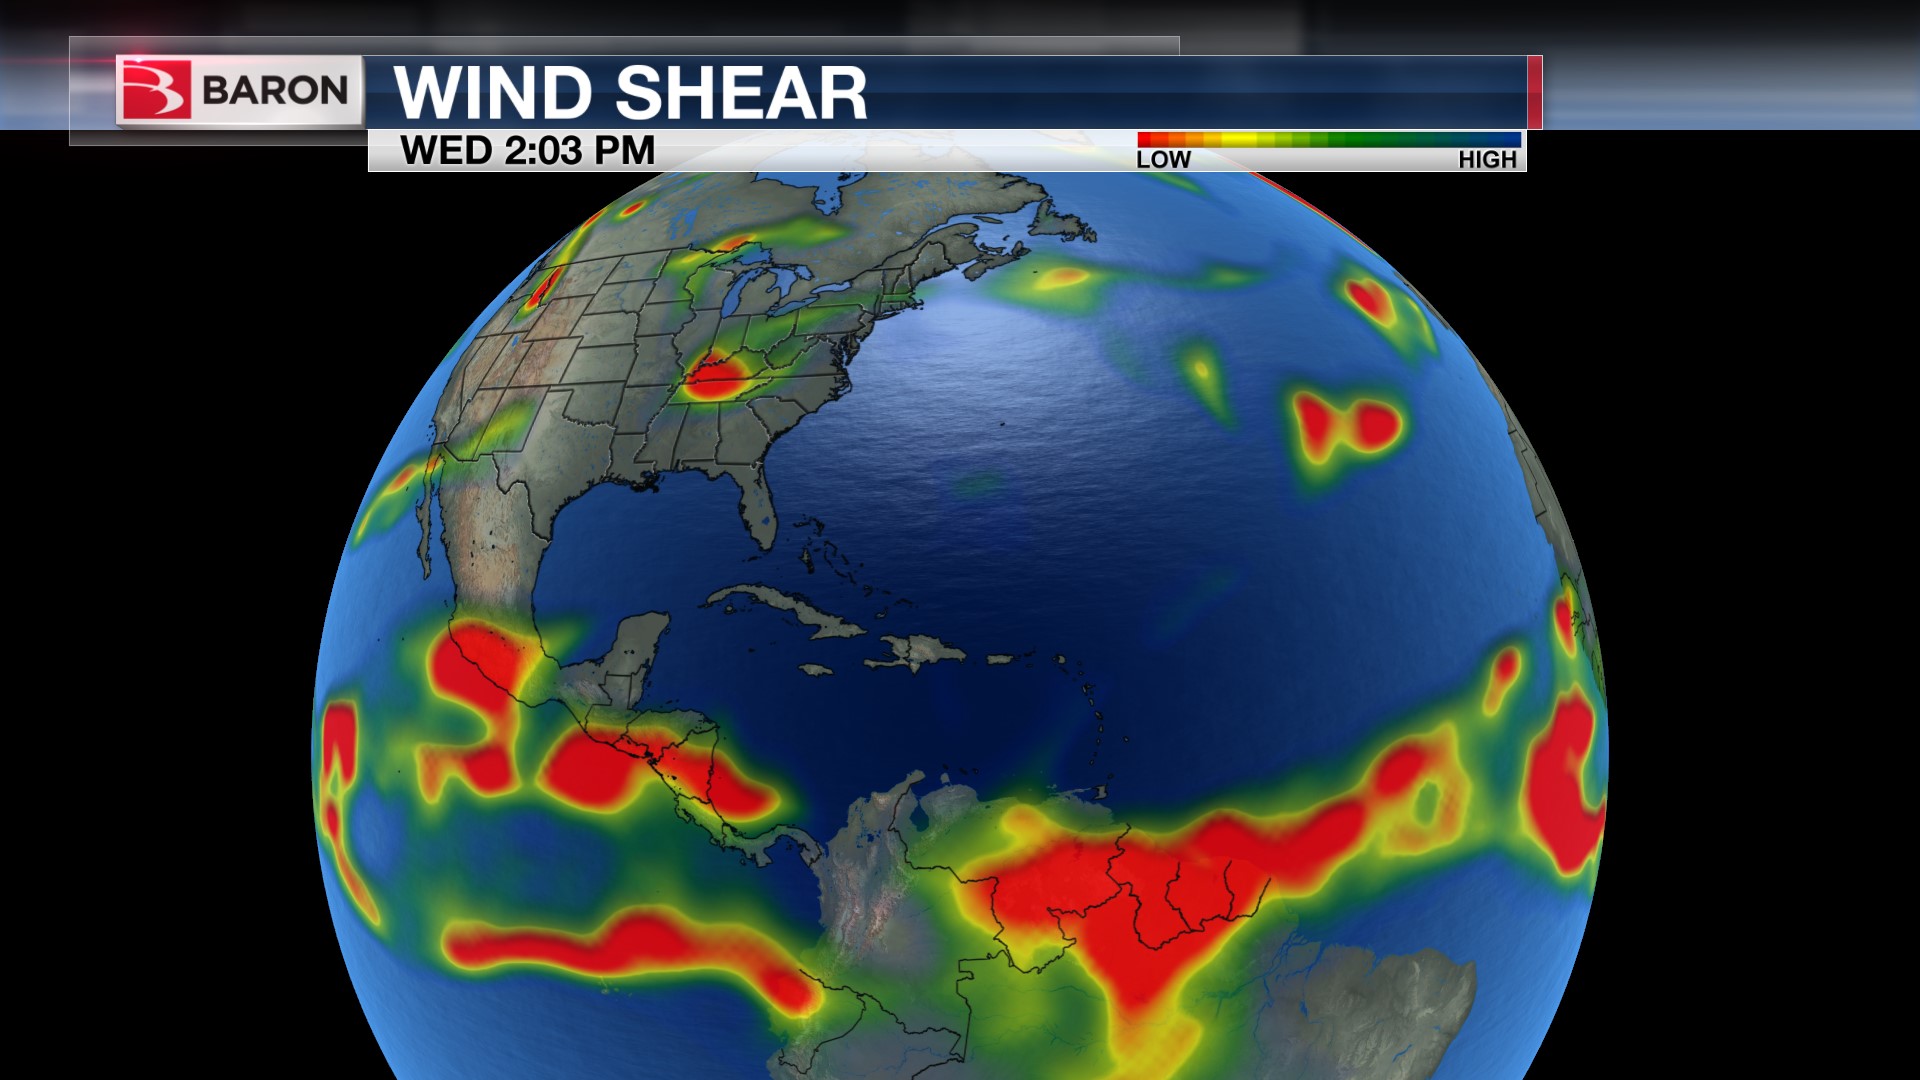
Current and Forecast Environmental Shear
Both a current view and a forecast of Environmental Shear are available to highlight areas where low shear exists, which could allow intensification to occur if other conditions are met.
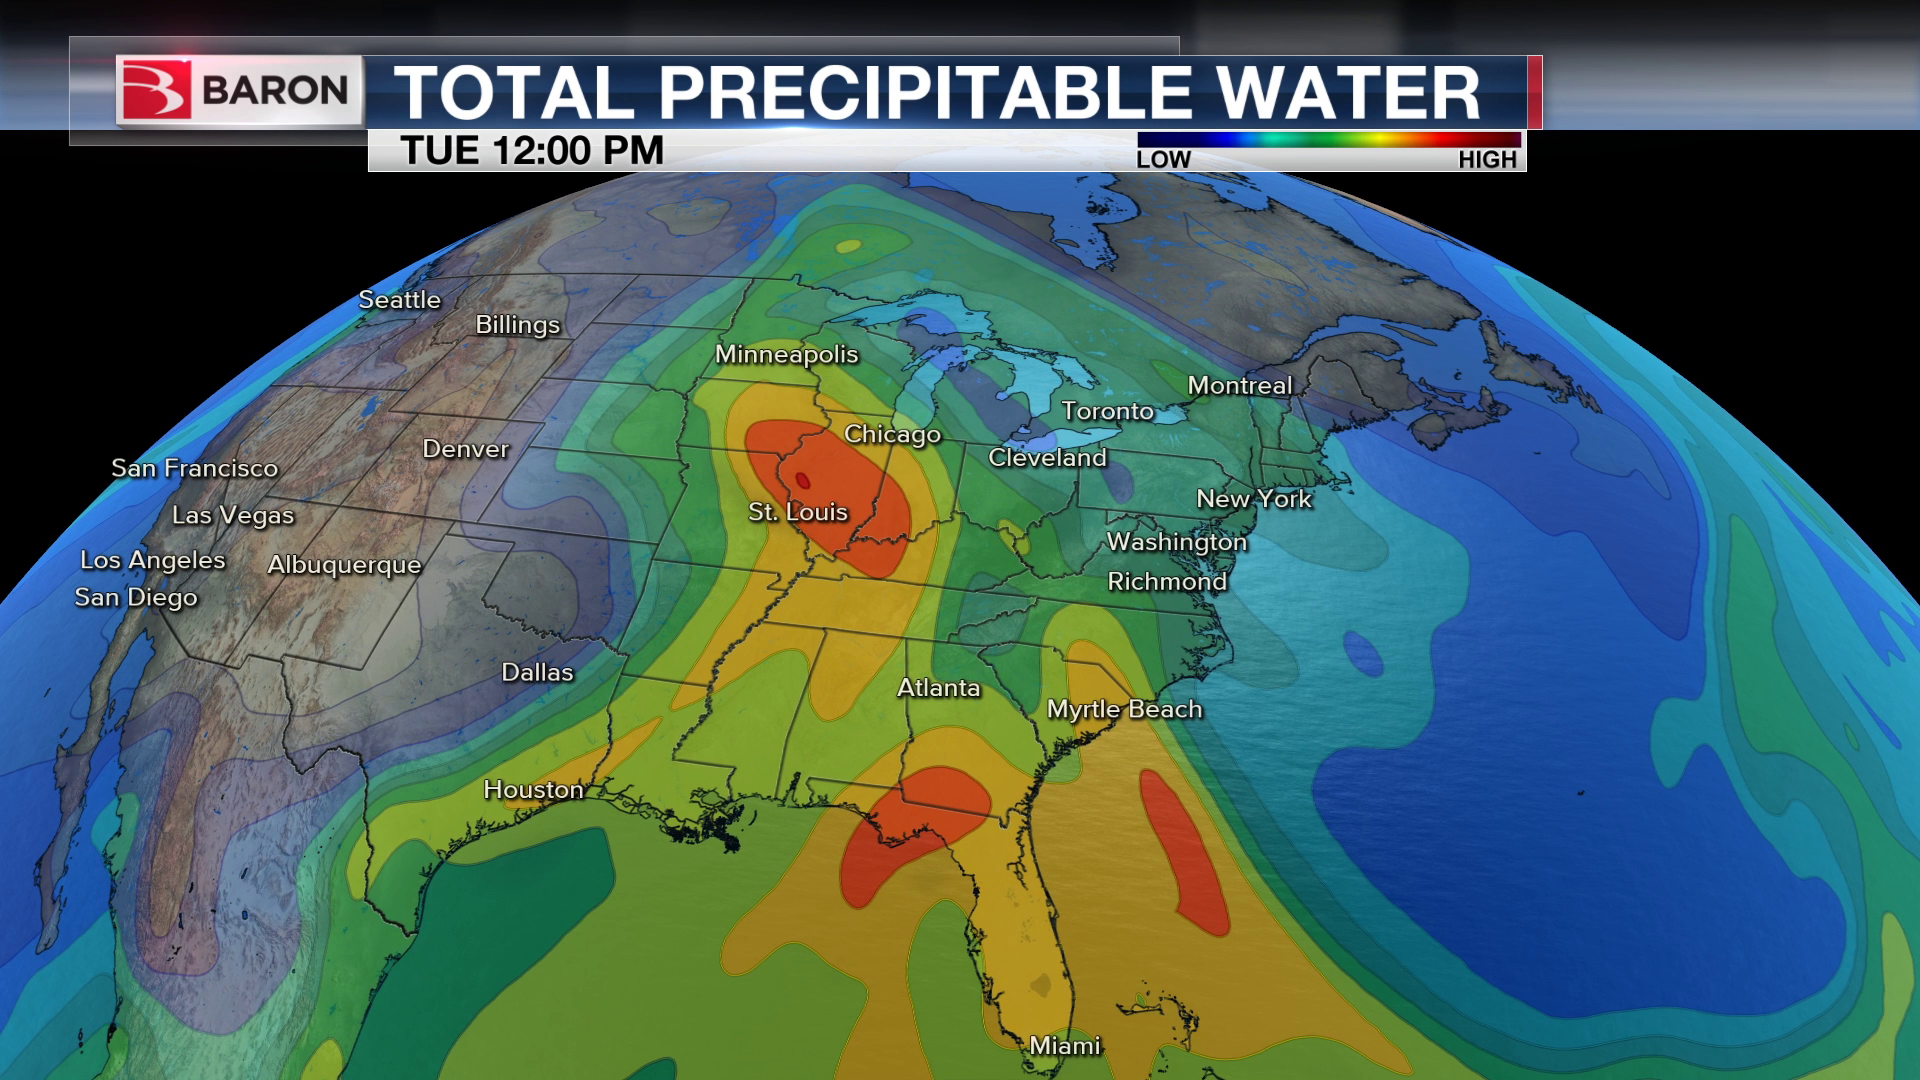
Current and Forecast Precipitable Water
A current snapshot and forecast of precipitable water, helpful in estimating the amount of moisture that is available in the atmosphere, which is necessary to maintain a healthy tropical cyclone.
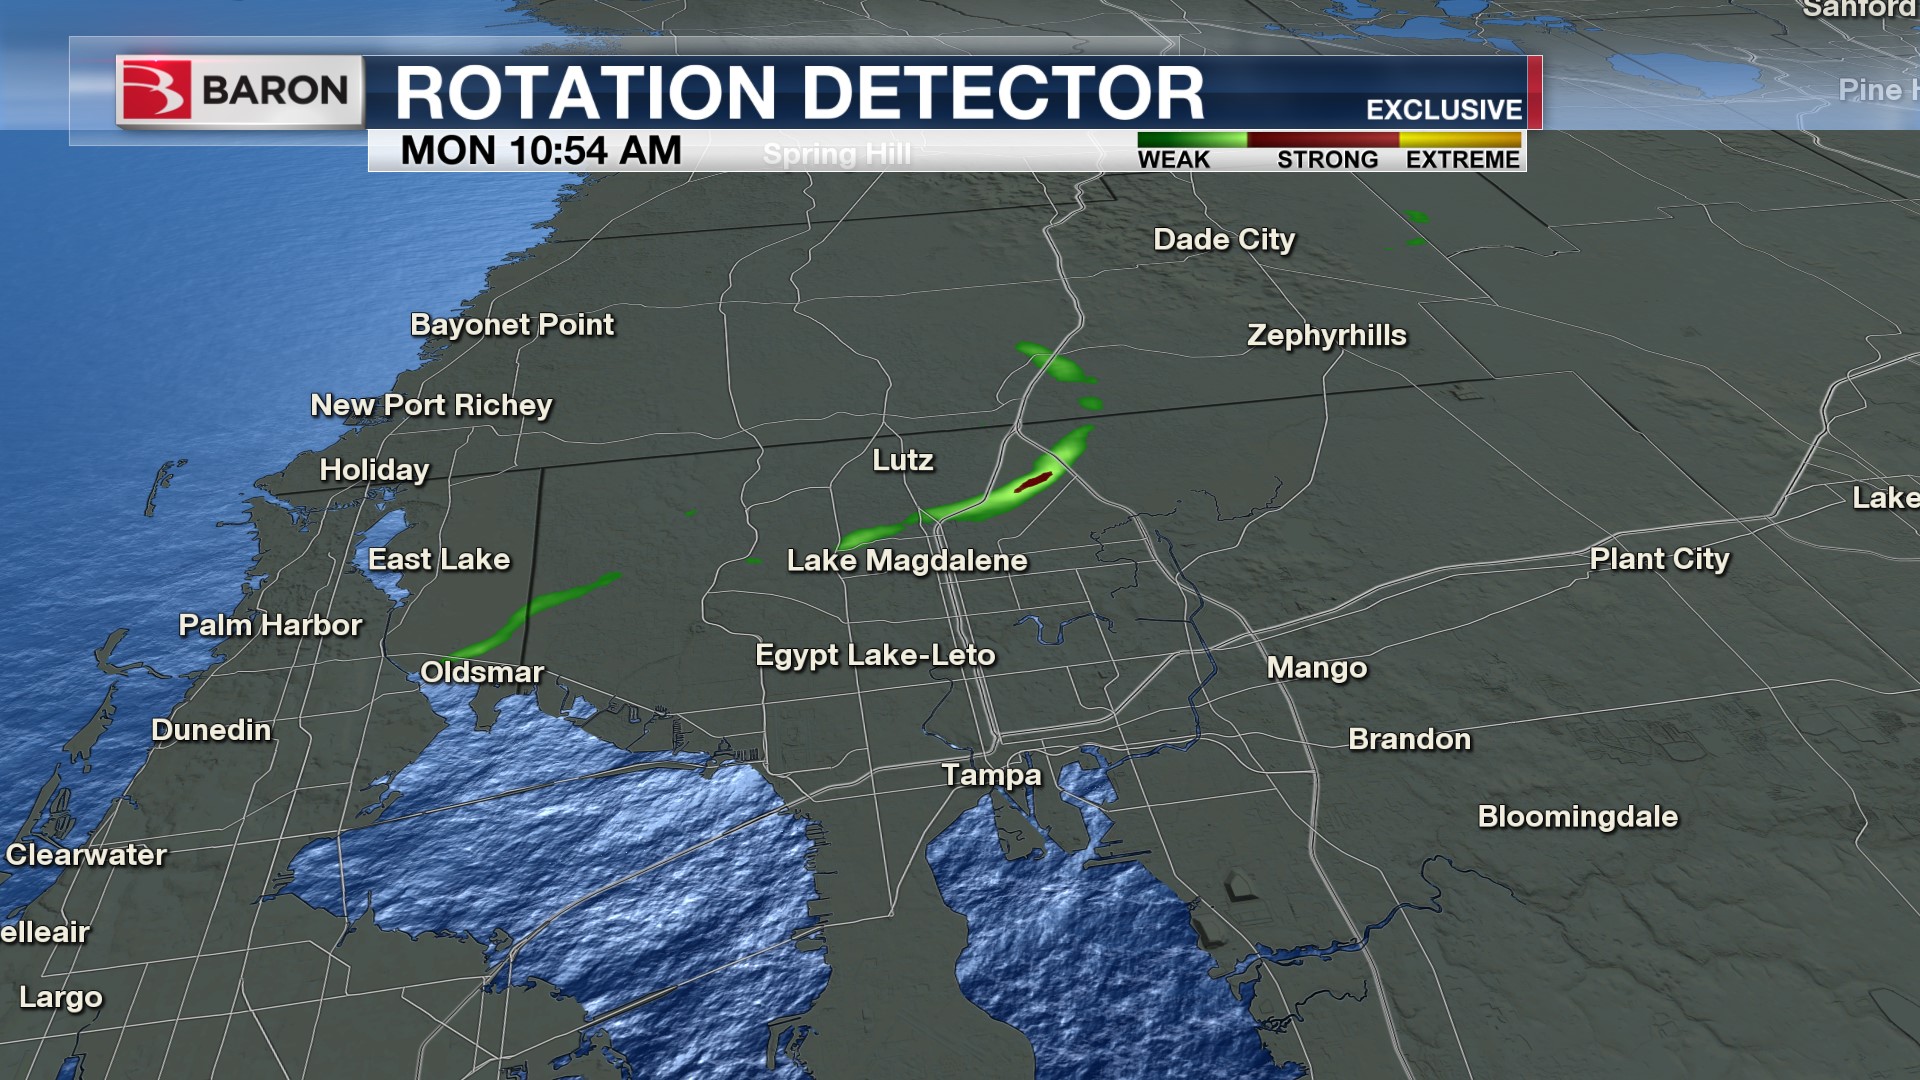
Shear Rate for Waterspouts/Tornadoes
The same product that is so widely used during severe thunderstorms and tornadic supercells is also extremely useful for more difficult to detect waterspouts and tornadoes that tropical cyclones can produce.
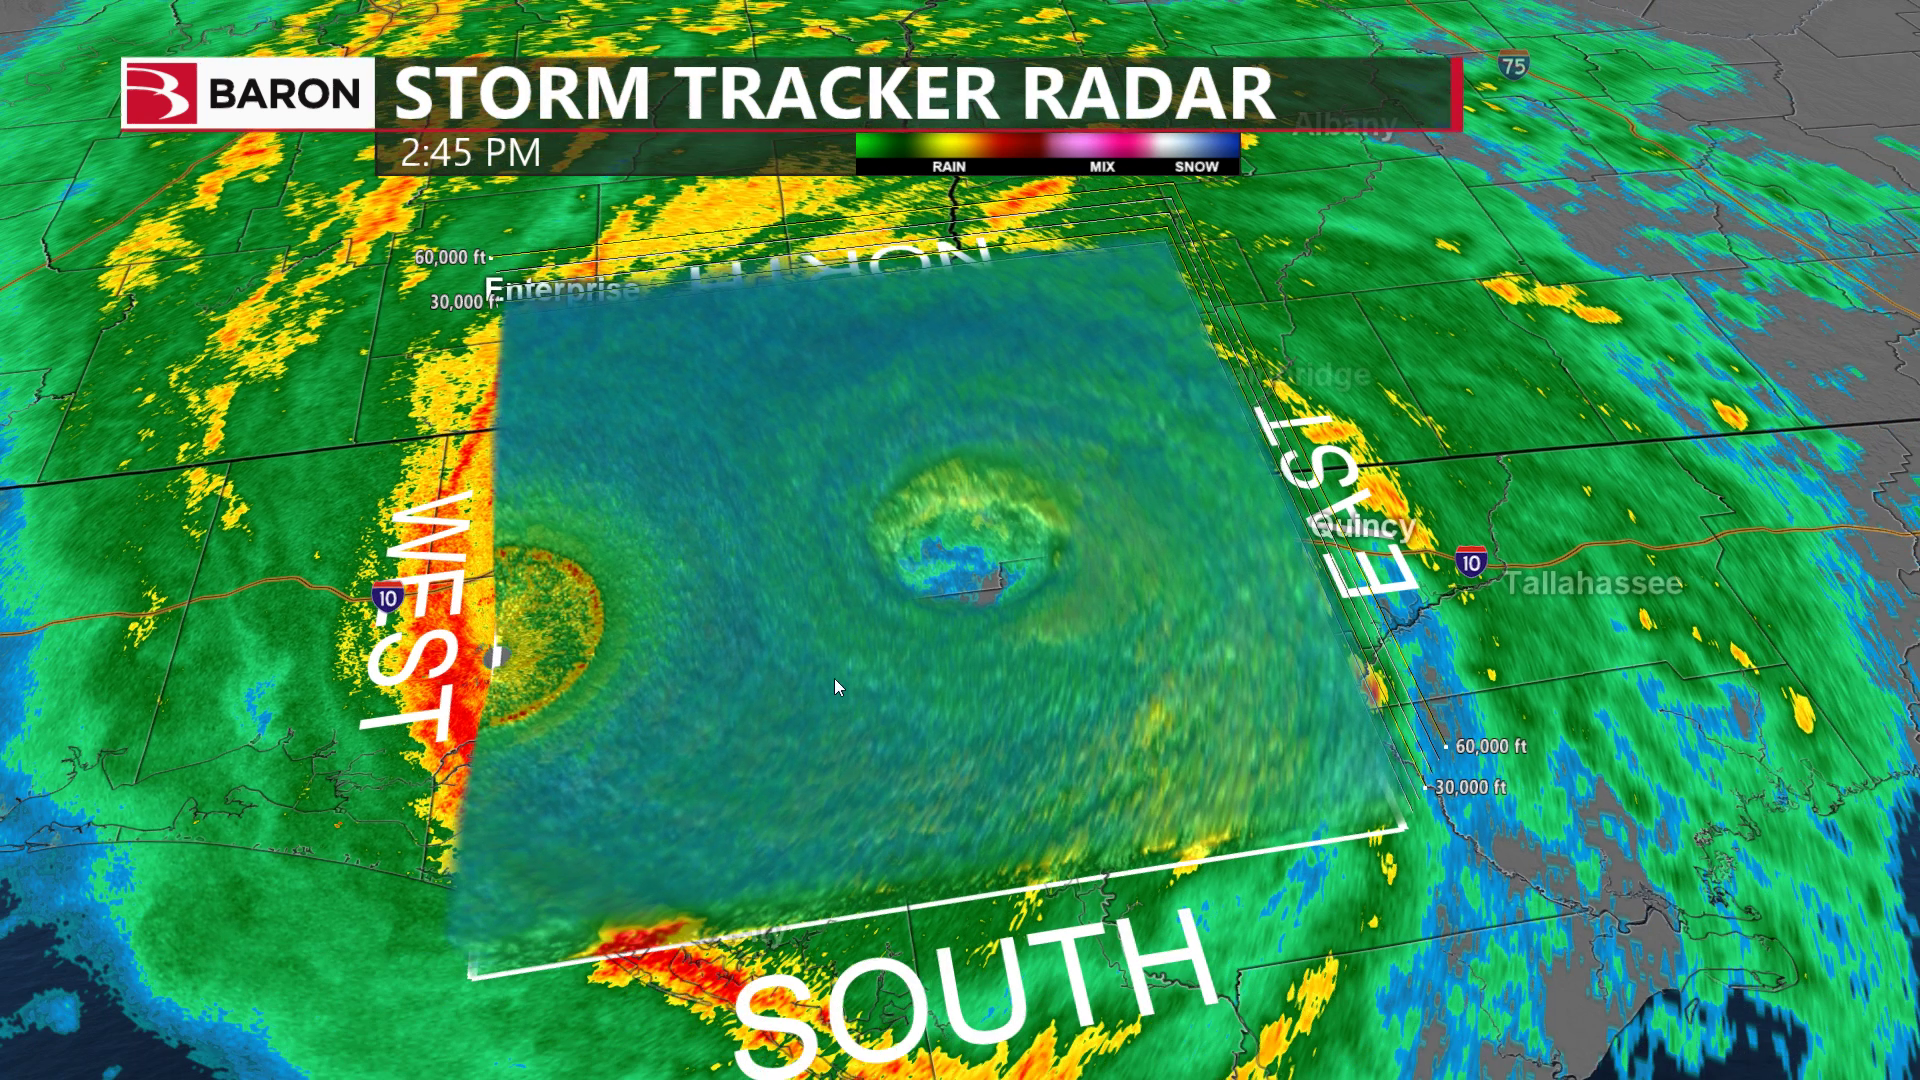
Volumetric Radar
A unique visual you can utilize in real-time is to show the 3D Volumetric Radar of a tropical cyclone as it nears landfall. This can provide an awesome look at the “stadium effect” associated with the eye of the hurricane.
Graphical Explainers
Don’t forget that we also provide numerous explainer graphics packages associated with tropical season, including hurricane structure, hurricane formation, storm surge, seasonal storm names and stats, formation zones, and more. Plus, when tropical cyclones are ongoing or forecast to occur, we include useful content in our daily graphics offerings.
