As the first day of summer arrives, it brings more than just longer days and higher temperatures. Across much of the country, the season marks the start of a high-risk period for many industries that are sensitive to heat - whether directly or indirectly. From strained power grids to stressed crops and vulnerable workers, the heat of summer can have widespread impacts on safety, operations, and infrastructure.
It's also not just about how hot it gets but about how often, how early, and how long that heat sticks around.
The Rising Risk of Extreme Heat
While summer heat is nothing new, recent years have brought more frequent and more intense extreme heat events. In Texas, for example, a 2022 heat wave sent temperatures soaring well past 100°F and set a new record for the state’s highest-ever daily electricity usage. Events like this highlight the growing strain placed on critical systems and how early, accurate weather insights can help mitigate risk. Read our insights on this below.
Excessive heat has been the leading cause of weather-related fatalities in the U.S. over the past 30 years. Climate change is making historically rare heat events more common in regions unaccustomed to such extremes - like the unprecedented Pacific Northwest heat wave in June 2021.
Industry Impacts: When Heat Becomes a Hazard
Whether it’s days of sticky humidity or just a few hours of extensive work in the sun, understanding your heat exposure risks are critical to protecting both people and operations.
Energy & Utilities
Prolonged high temperatures drive up electricity demand - especially for cooling - while reducing generation efficiency. This increases the likelihood of power outages at times of peak usage. Baron’s high-resolution temperature and heat index forecasts, along with predictive analytics and power outage data by county and state, help utilities anticipate surges and plan grid responses more effectively.
Construction
Workers in construction and outdoor trades are especially vulnerable to heat illness, and extreme heat can halt progress on large-scale projects. Baron’s localized alerting solutions let contractors and safety managers manage real-time warnings and shift work schedules based on environmental risk levels.
Aviation
Hotter air reduces lift, which can limit aircraft takeoff capacity and force flight delays or cancellations. Heat can also affect runway infrastructure and ground crew safety. With Baron’s aviation forecasting tools, including high-resolution temperature data and fire/smoke/ash detections, enable airports to anticipate heat-related disruptions and plan safer operations.
Transportation & Infrastructure
High heat can cause roadways to buckle, rail lines to warp, and reduce vehicle performance. Baron supports DOTs and logistics providers with real-time monitoring and nationwide critical weather indicators, enabling better deployment of crews and mitigation strategies.
Agriculture
Excessive heat stresses crops, reduces yields, and alters planting and harvest cycles. Livestock are also at greater risk. Baron provides agriculture-specific data and analytics such as soil moisture indices, drought severity, and fire hot spot detection, to help farmers and agribusinesses minimize losses and plan irrigation more strategically.
Smarter Data, Safer Response
Record temperatures may grab headlines but it’s the data-driven planning behind the scenes that keeps people safe and operations running.
Baron’s Extreme Weather Index is one such tool designed to detect six key hazards, including extreme heat, cold, wind, hail, heavy rain, and snow, up to 10 days in advance. This index accounts for how unusual a forecast is compared to historical norms and helps identify potentially high-impact events.
For example, on June 19, 2024, the Baron Extreme Weather Index flagged a heat wave in eastern Canada as “extreme” on the scale even though similar actual temperatures were occurring in the United States. The difference? Eastern Canada was 20–30°F above average making the impact far more significant and record-breaking for that region. Read more here.
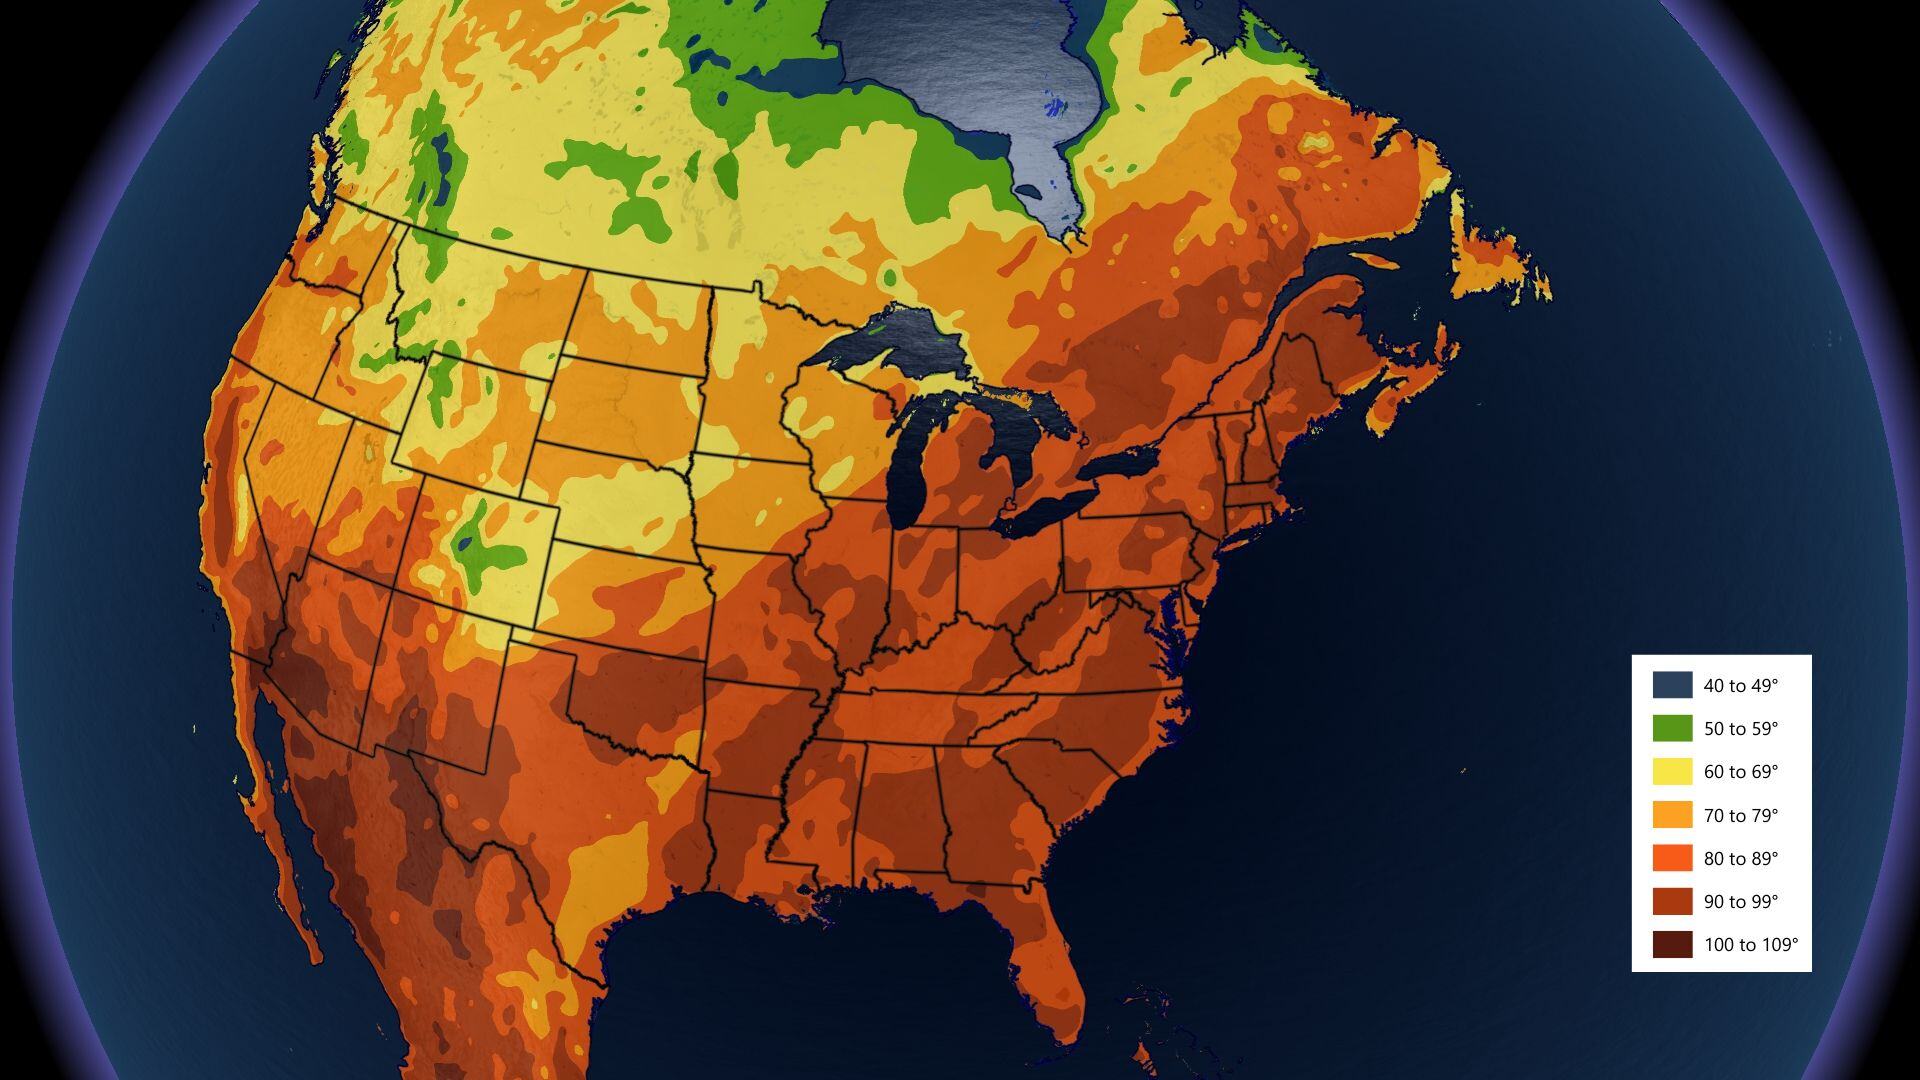
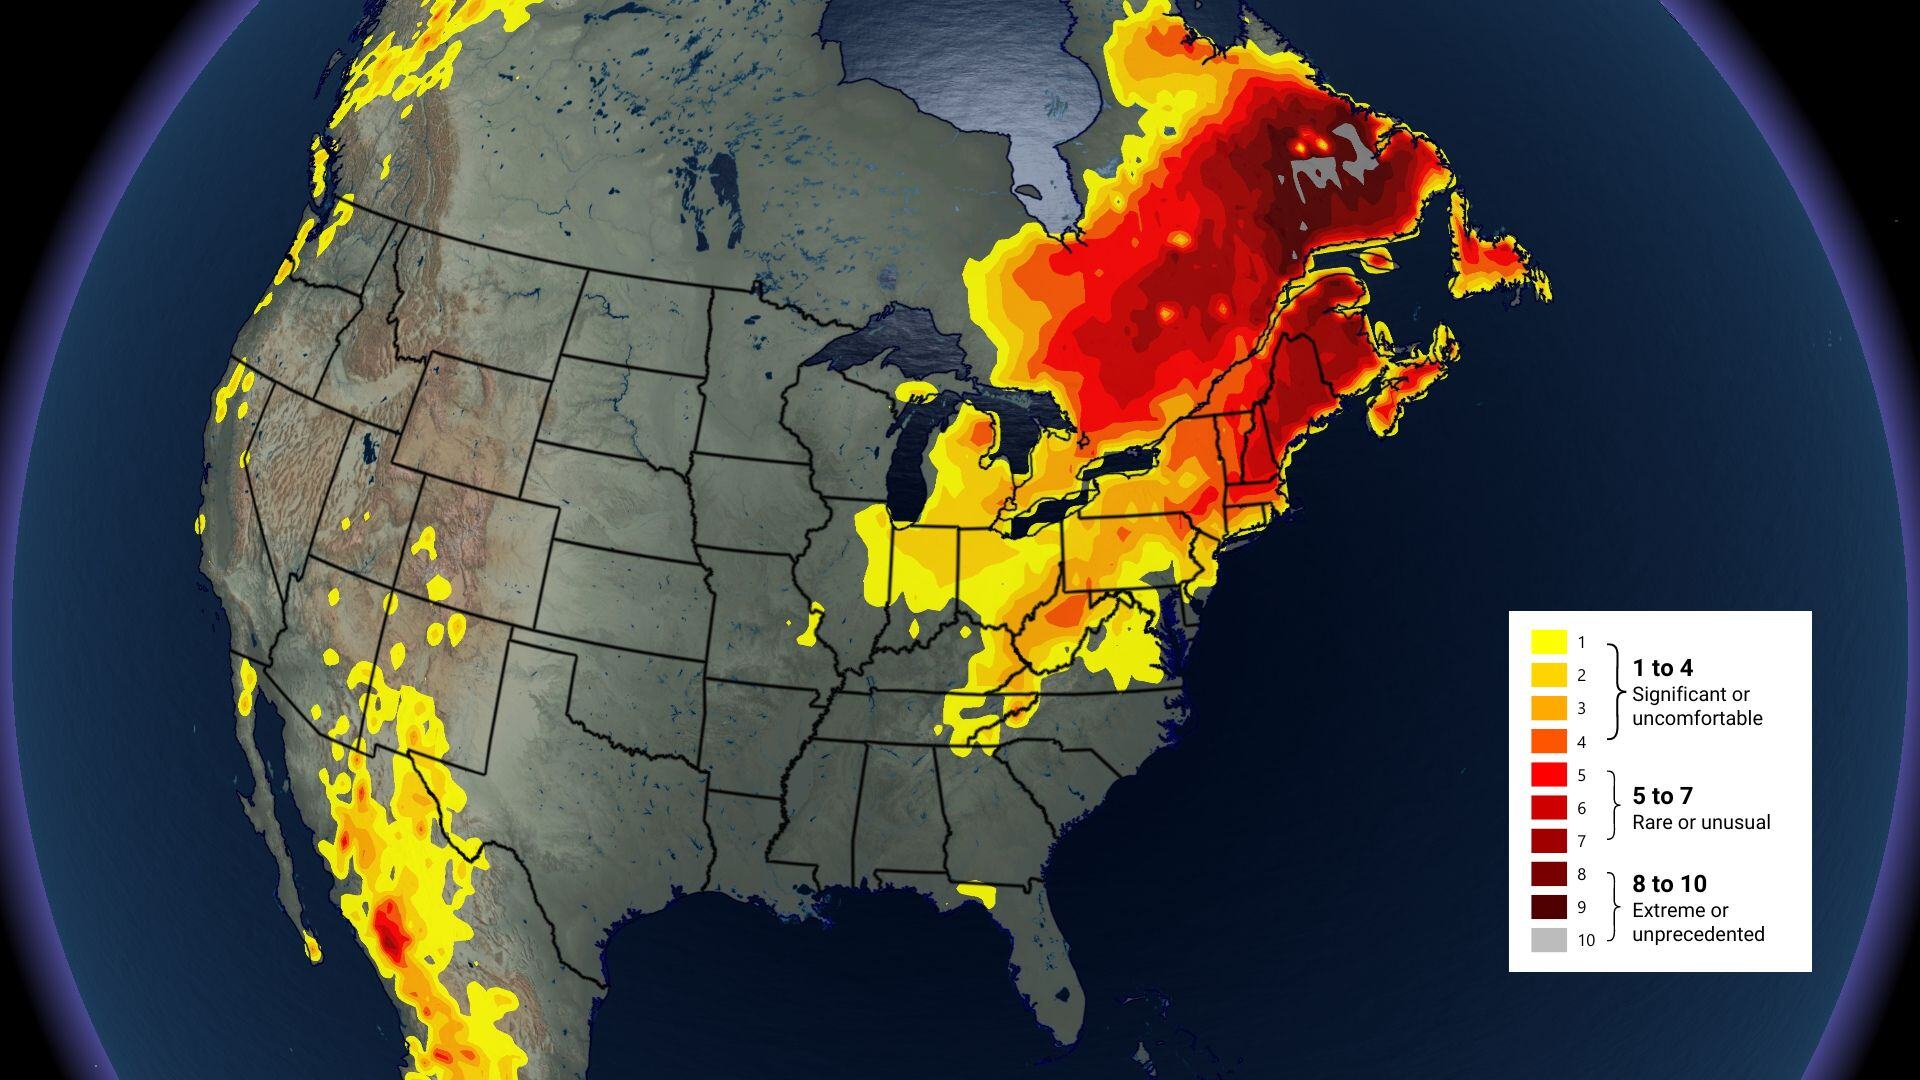
The image comparison above shows the difference between a forecast model showing widespread heat (left) versus where the Baron Extreme Weather Index highlights only the unprecedented heat (right).
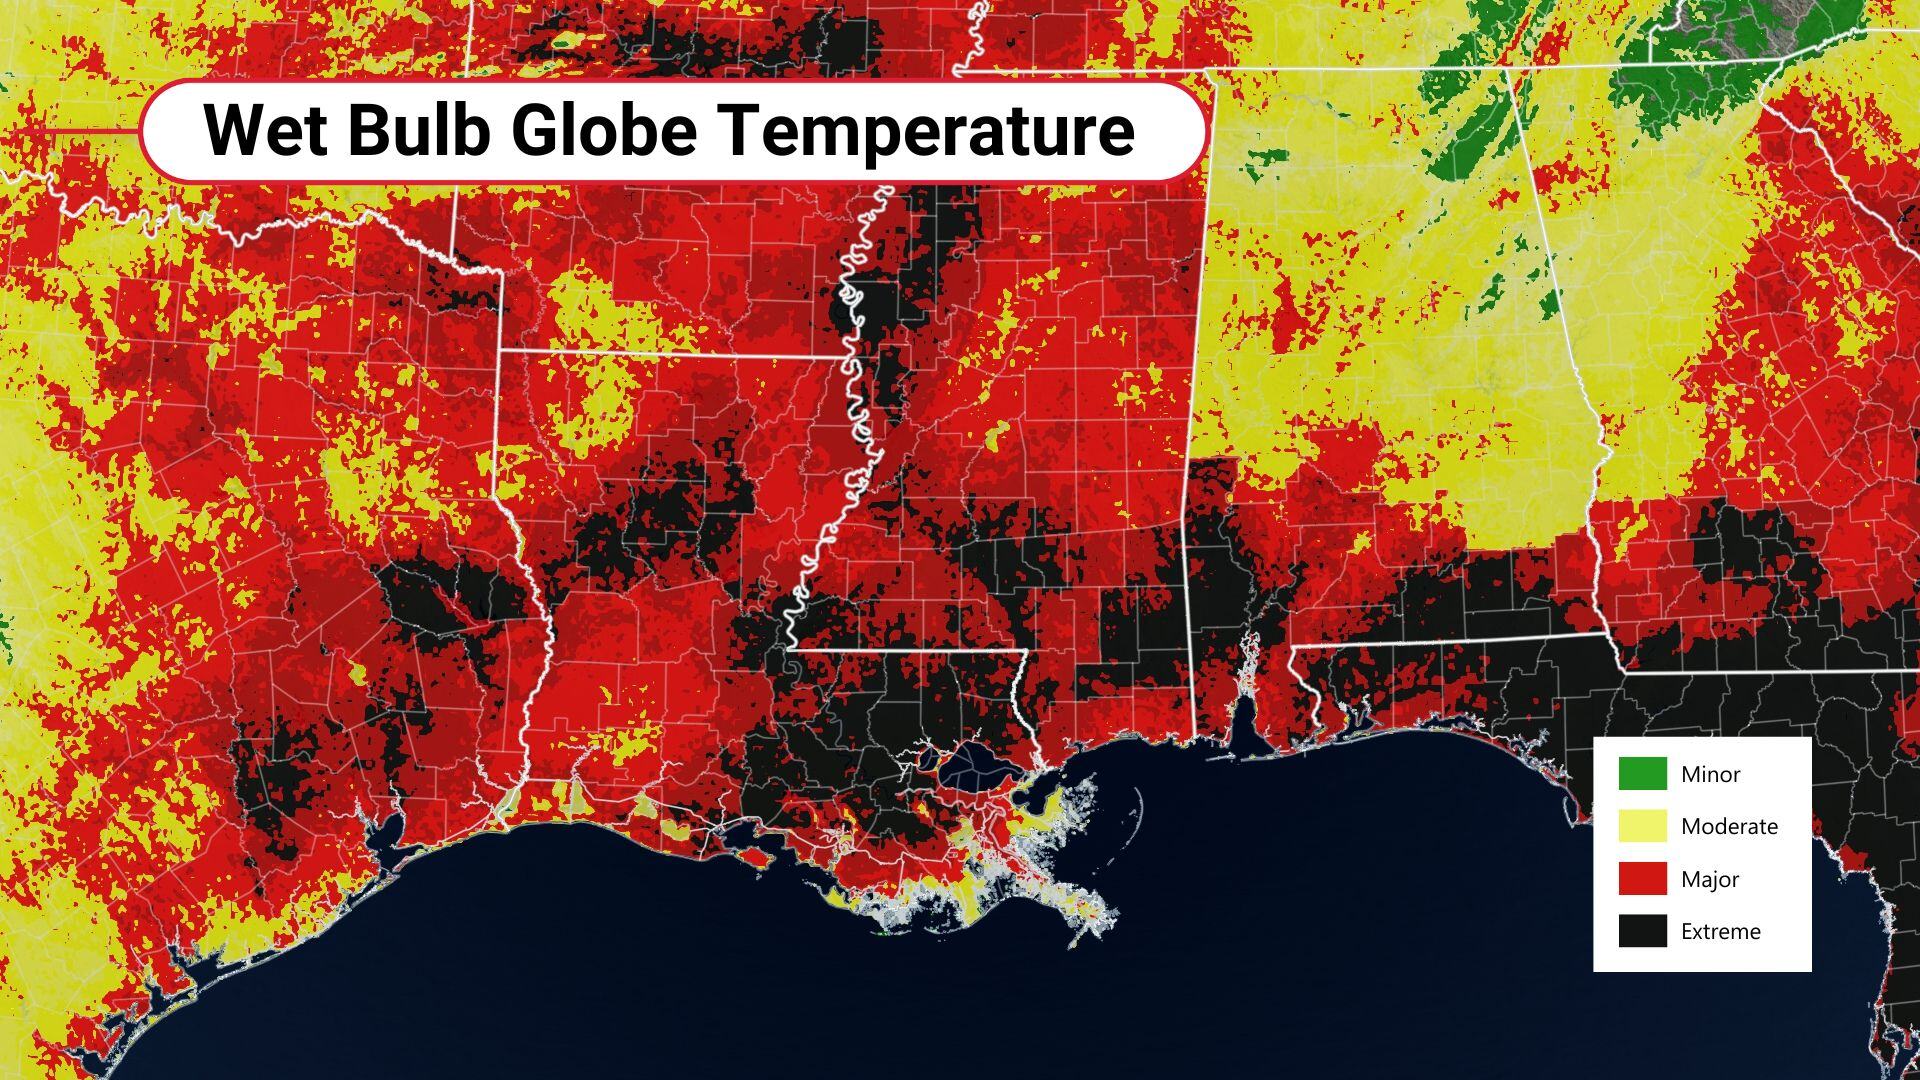
Another essential tool is the Wet Bulb Globe Temperature (WBGT), which measures environmental heat stress on the human body. WBGT combines temperature, humidity, wind speed, and solar radiation. helping public safety teams, universities, and athletic departments assess safe activity levels. WBGT forecasts are most effective within a 24–48-hour window, and readings over 90°F are considered dangerous for strenuous activity.
From custom dashboards and ArcGIS integrations to automated alerting and localized forecasting, Baron’s weather solutions are built to help industries prepare for and respond to the growing risks of extreme heat. When every degree matters, so does the accuracy and context of your weather insights.
