Not all severe weather events are the same, and some are extremely complex. Cutting through the clutter to focus on what is truly life-threatening can save lives.
Millions of Americans were at risk of damage to life or property from a strong front sweeping through the South on March 30, 2022. The powerful storm system was not only capable of producing tornadoes, but widespread power outages from non-thunderstorm wind gusts as well.
When multiple hazards are possible at different times of day, processing so much information can be cumbersome and confusing not just for the public but even for a public safety professional who must make critical decisions quickly.
Severe thunderstorms in the South are often surrounded by large areas of rain or other cells, prompting numerous warnings. This was apparent with the supercells across central and southern Alabama during this event, where multiple types of polygon warnings from the National Weather Service covered similar areas.
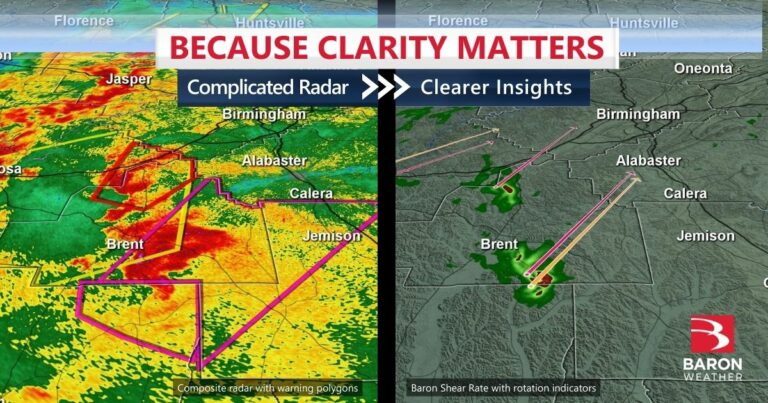
Baron’s exclusive Shear Rate algorithm derives critical data from a full radar scan to precisely show where tornadic and straight-line winds are likely occurring. The demonstration above contrasts a normal radar view with warning polygons from Baron’s Shear Rate and Critical Weather Indicators identifying where the tornado occurred and who was at risk next.
Another type of wind damage was verified Wednesday evening across portions of Alabama, Tennessee and Mississippi. Multiple reports of damage from non-thunderstorm wind gusts occurred hundreds of miles ahead of the squall line.
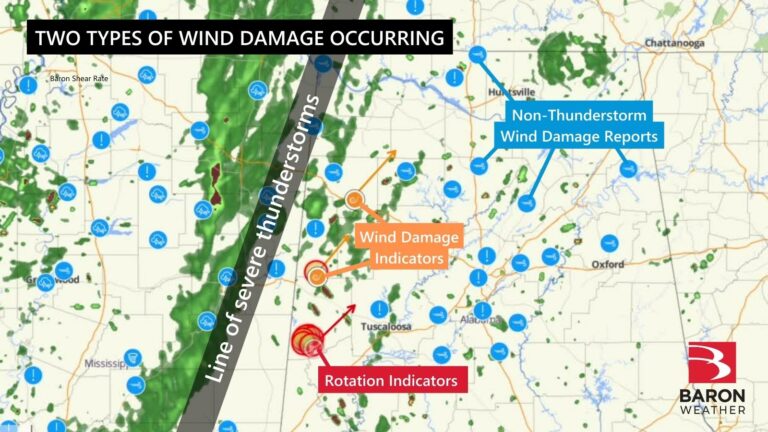
It was also clear that the event was causing widespread power outages across several states as a result of both the line of severe storms and the non-thunderstorm wind gusts. This data would be helpful to assess the scope of a significant weather event immediately and its current impact on infrastructure.
The products mentioned in this story are available to developers through the Baron API or media professionals through the Lynx platform. Emergency response personnel can also customize products and views unique to their circumstance in the Baron Threat Net web or mobile application.
