National Hurricane Preparedness Week is May 3-9, 2026.
Every May, NOAA dedicates a week to reminding communities what's at stake when Atlantic hurricane season arrives. The themes are consistent: know your risk, make a plan, understand the forecast, and act before it's too late. The message is important. But behind every one of those themes is a harder, more operational question — how, exactly?
How do you know your specific risk? How do you know when to act? How do you make sure the right people are informed at the right time? The answers don't come from a checklist. They come from the right weather intelligence, built into the right systems, before a storm forms.
Here's how each of this year's NOAA preparedness themes maps to what that looks like in practice.
Know Your Risk: Water & Wind
Knowing your risk isn't just knowing you live near the coast. It's understanding precisely what wind speeds, rainfall totals, or storm surge levels would cross a threshold that matters for your community or organization — and then having a system in place that watches for those thresholds automatically, around the clock, with a way to be notified when it counts.
That's what Baron's Weather Logic is built for. Rather than monitoring generic public alerts, Weather Logic allows users to configure automated alerts based on the specific parameters that matter to their operations and assets — a particular wind speed at a facility, a rainfall threshold in a drainage basin, or a storm surge forecast that triggers evacuation protocols. When conditions approach those thresholds, the right people are notified automatically, with enough lead time to act.
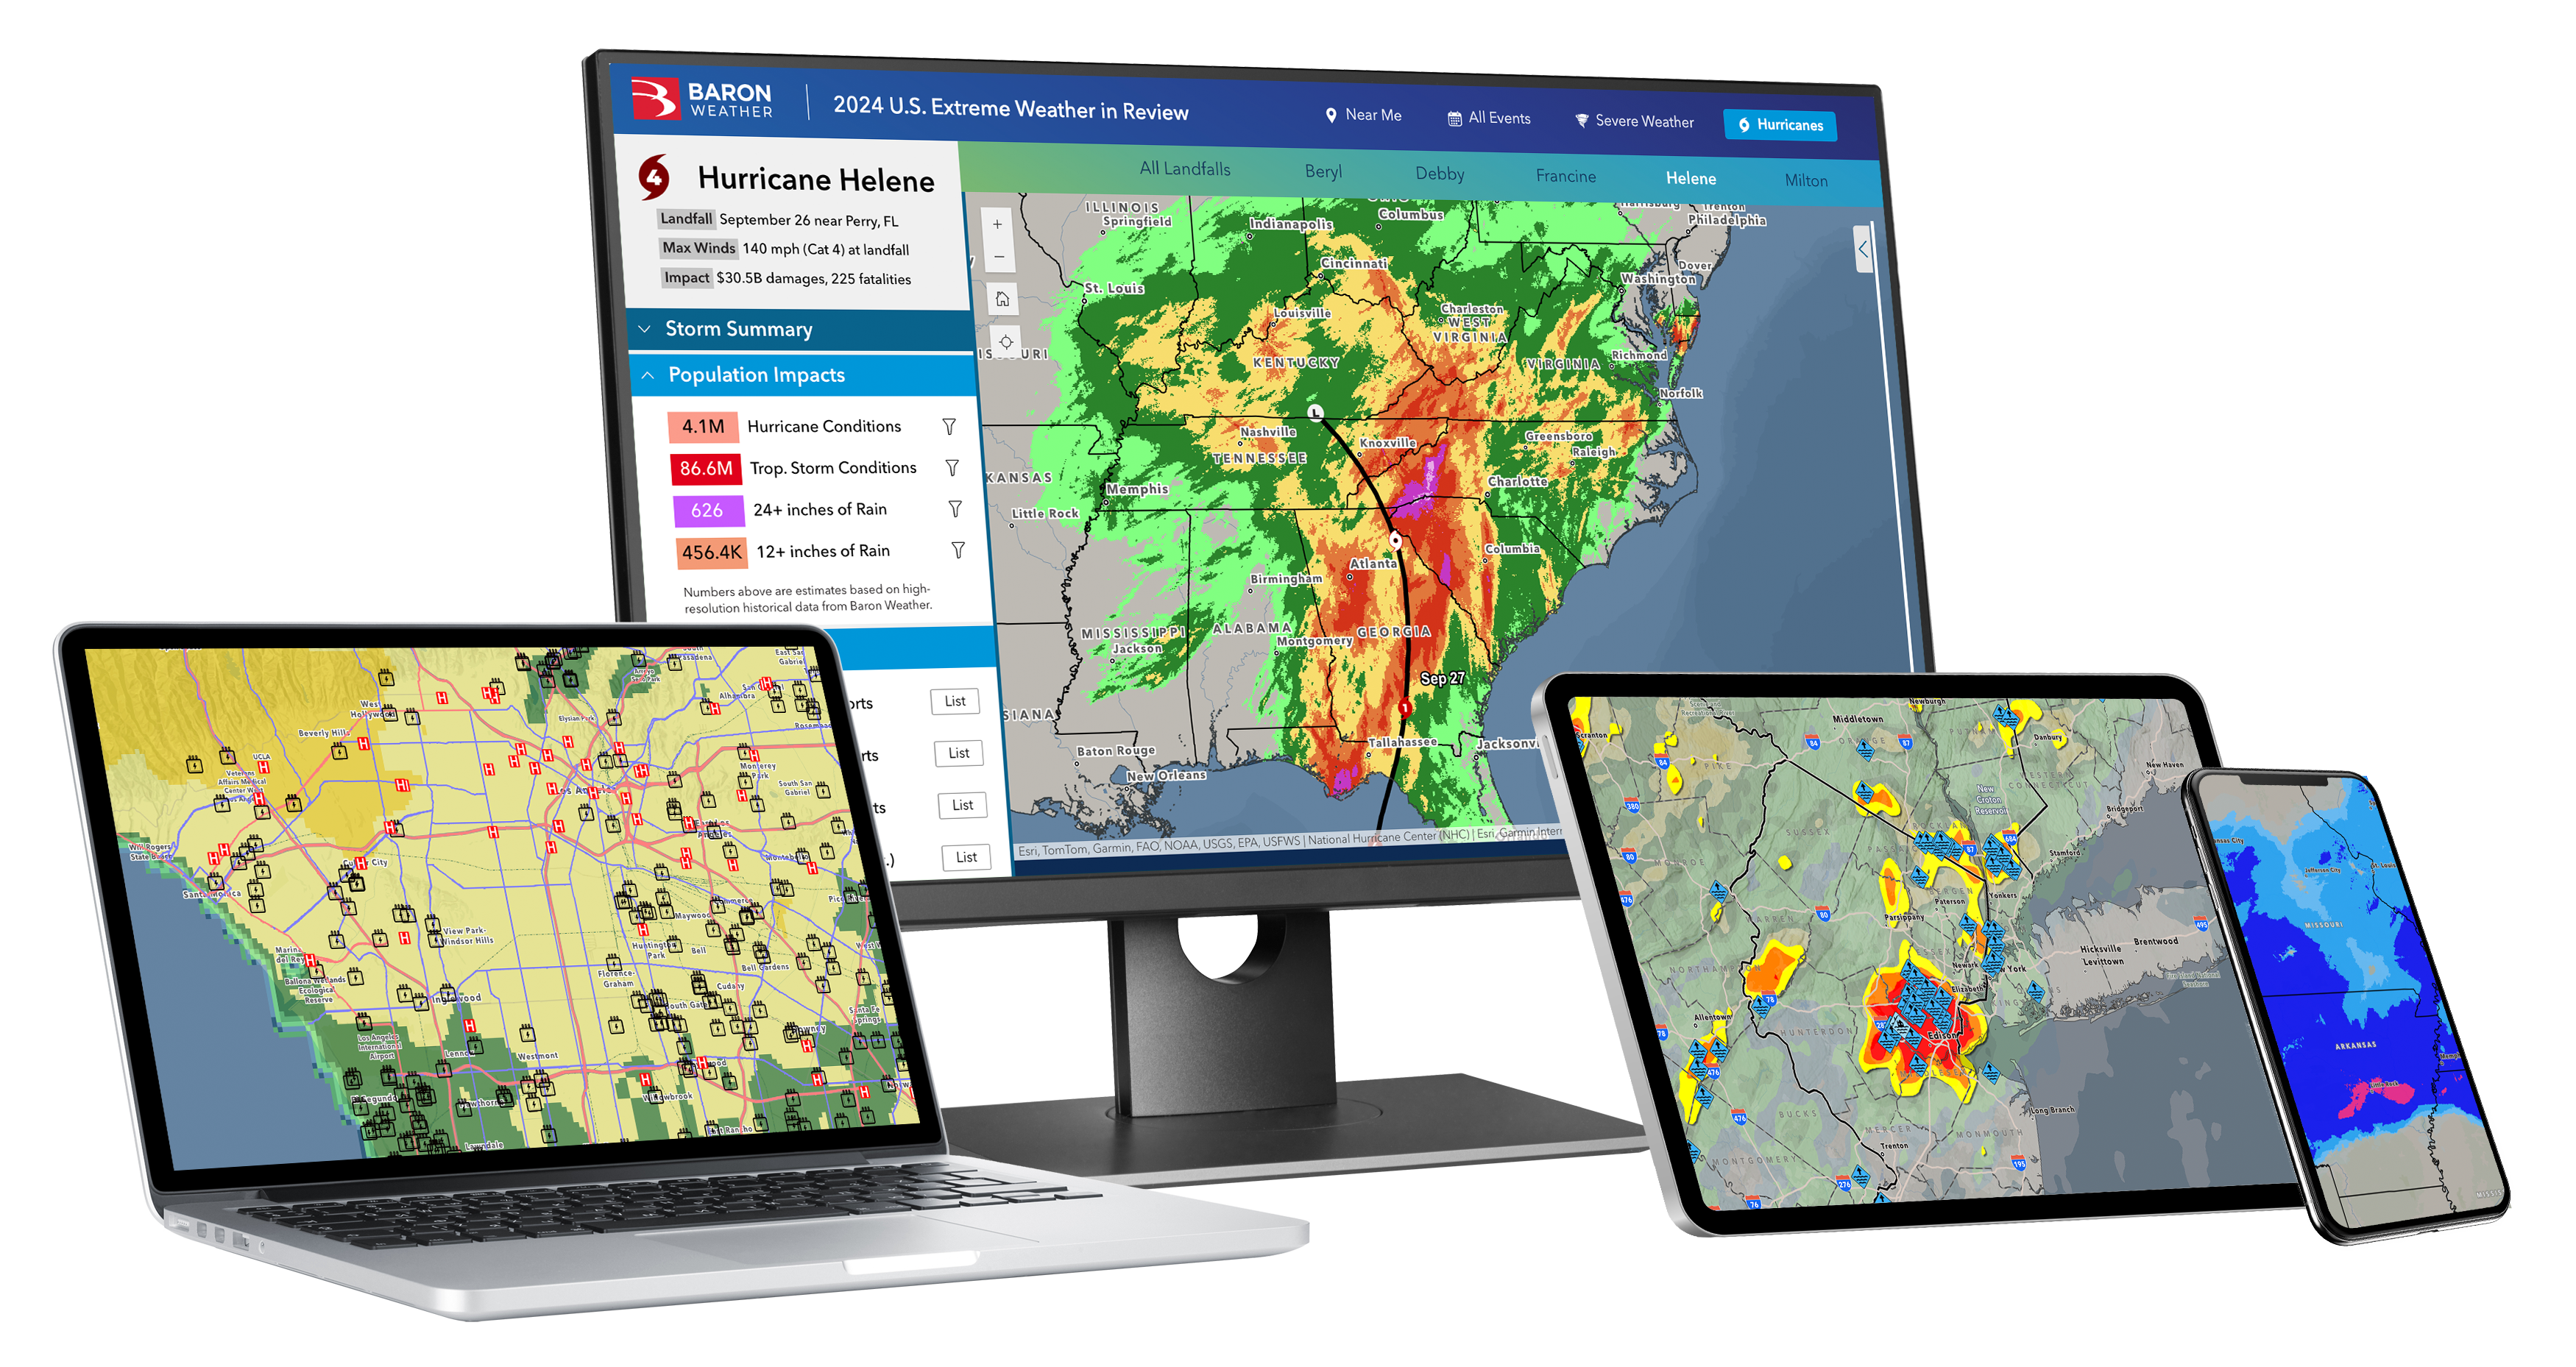
For organizations working in ArcGIS, Baron's ArcGIS Weather Layers take that a step further — overlaying real-time and forecast weather data directly onto infrastructure maps, service territories, and critical assets. When your weather data lives in the same environment as your operational data, risk becomes something you can see, measure, and respond to — not just something you're aware of. Understanding risk requires more than general awareness. It requires data that speaks directly to your situation — making it actionable, not just helpful.
Prepare Before Hurricane Season
The window to prepare closes faster than most people expect. By the time a storm is named and a cone appears on the map, the time for planning has passed — whether that's stocking supplies at home, or configuring systems and running through protocols at the organizational level.
The same goes for knowing how to read and trust a forecast before a storm matters. A Decision-Maker's Guide for Your Hurricane Plan is a great place to start — it walks through what credible decision-making looks like at each stage of a storm's approach, from early model signals days out to the final hours before landfall, and why acting too early can be just as costly as acting too late.
Pre-season preparation also means knowing what tools will be relied on under pressure. For broadcast meteorologists, that means ensuring visualization systems are ready to clearly communicate complex storm data to audiences who need to understand quickly and act accordingly. For emergency managers and operations centers, it means configuring alerting thresholds, reviewing data integrations, and running through scenarios before conditions are real.
The people and organizations that navigate hurricane season well aren't the ones who scramble when a storm appears. They're the ones who were already ready.
Understand Forecast Information
One of the most persistent challenges in hurricane communication is the gap between what the forecast actually says and what people understand it to mean. The cone of uncertainty remains one of the most misread graphics in meteorology — widely interpreted as showing where the storm will be strongest, when it actually only depicts the probable track of the center, with hazards extending well beyond its edges.
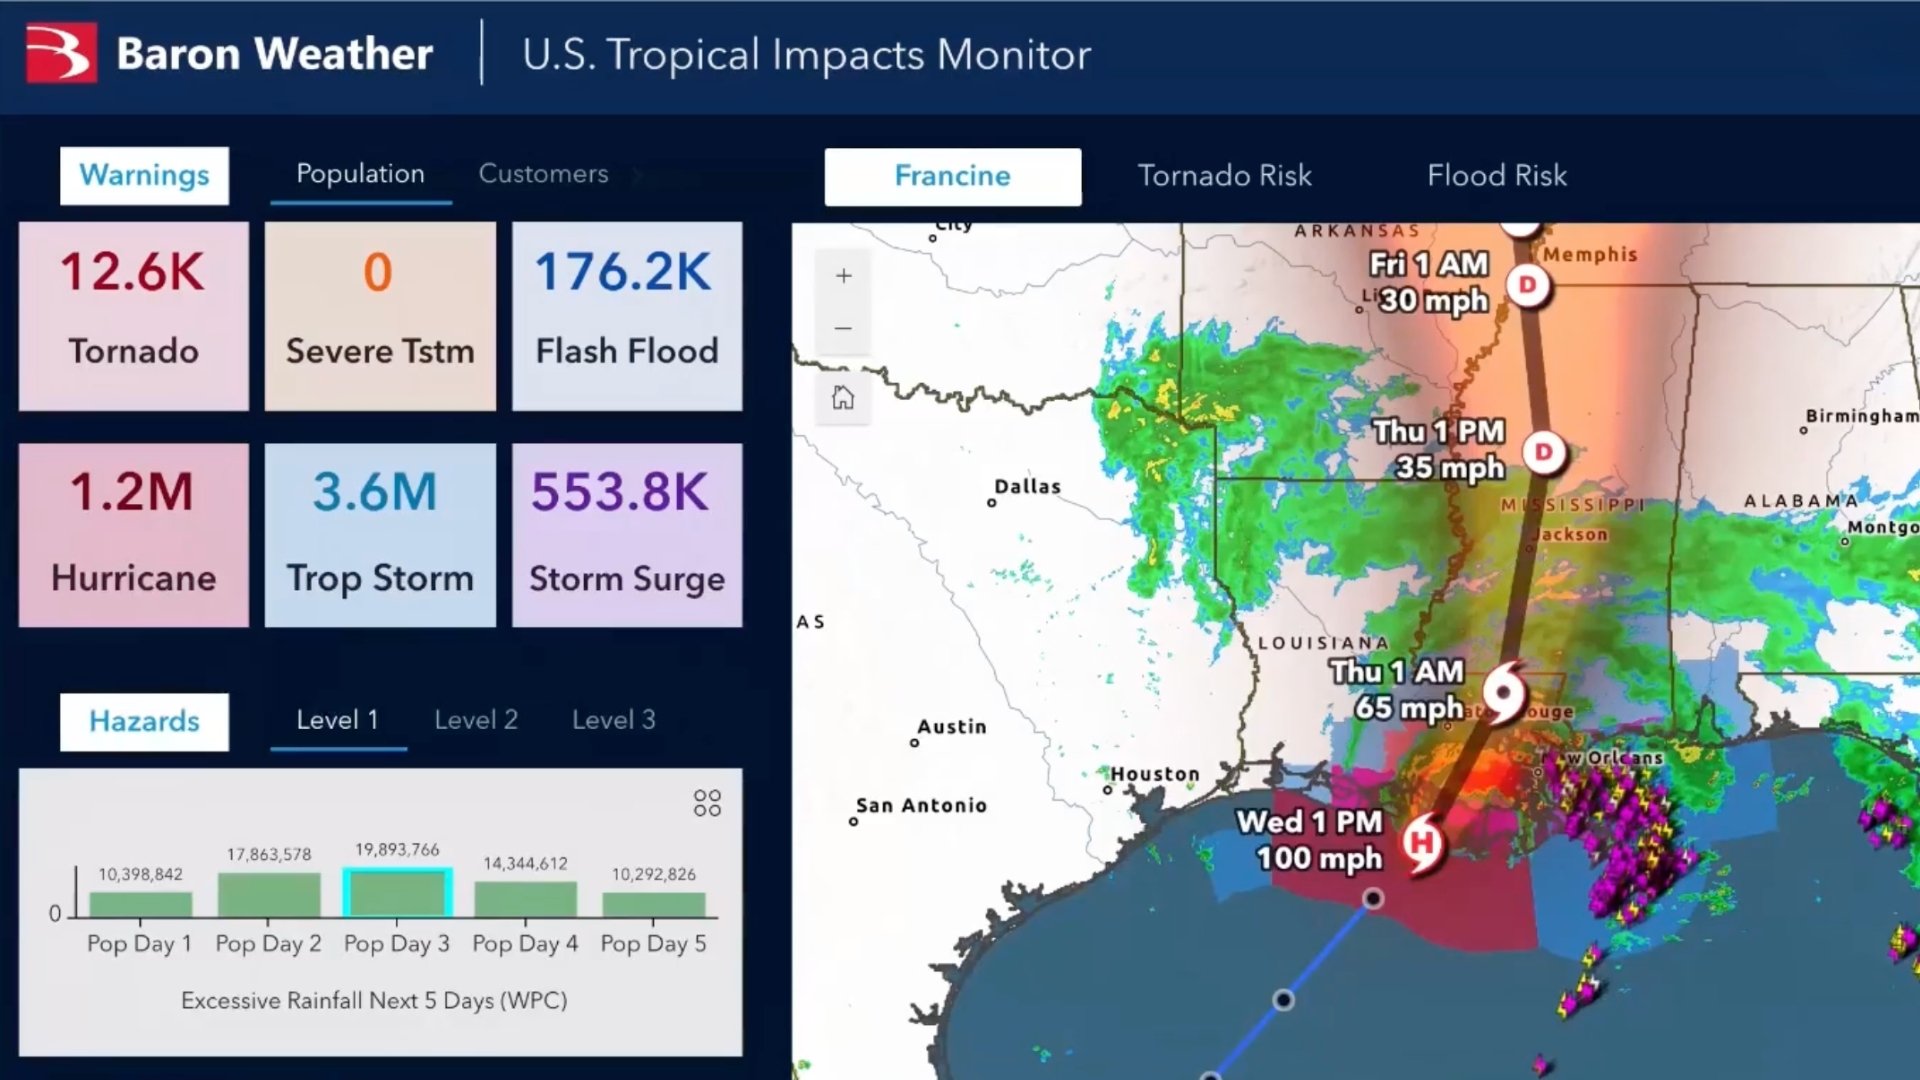
Closing that gap is what Baron Lynx is designed to do. Lynx provides the visualization tools to translate complex forecast data into something audiences can see, understand, and act on — from animated storm track and intensity graphics to storm surge inundation maps and probabilistic rainfall overlays.
And Lynx isn't just for broadcast — utilities, emergency managers, and other organizations use it to power daily weather briefings, keeping their teams informed and aligned on what's coming long before conditions deteriorate.


Baron's ArcGIS Weather Layers bring that same forecast clarity into the systems teams already work in. Impact-focused datasets — including power outages, flash flood risk, and road conditions — overlay directly onto infrastructure maps, community boundaries, and critical assets, so decision-makers can see not just where the storm is going, but what it's going to affect.


Forecast literacy isn't just a public education challenge. It's an operational one, and the tools used to display and communicate weather data play a direct role in outcomes.
Get Moving When a Storm Threatens
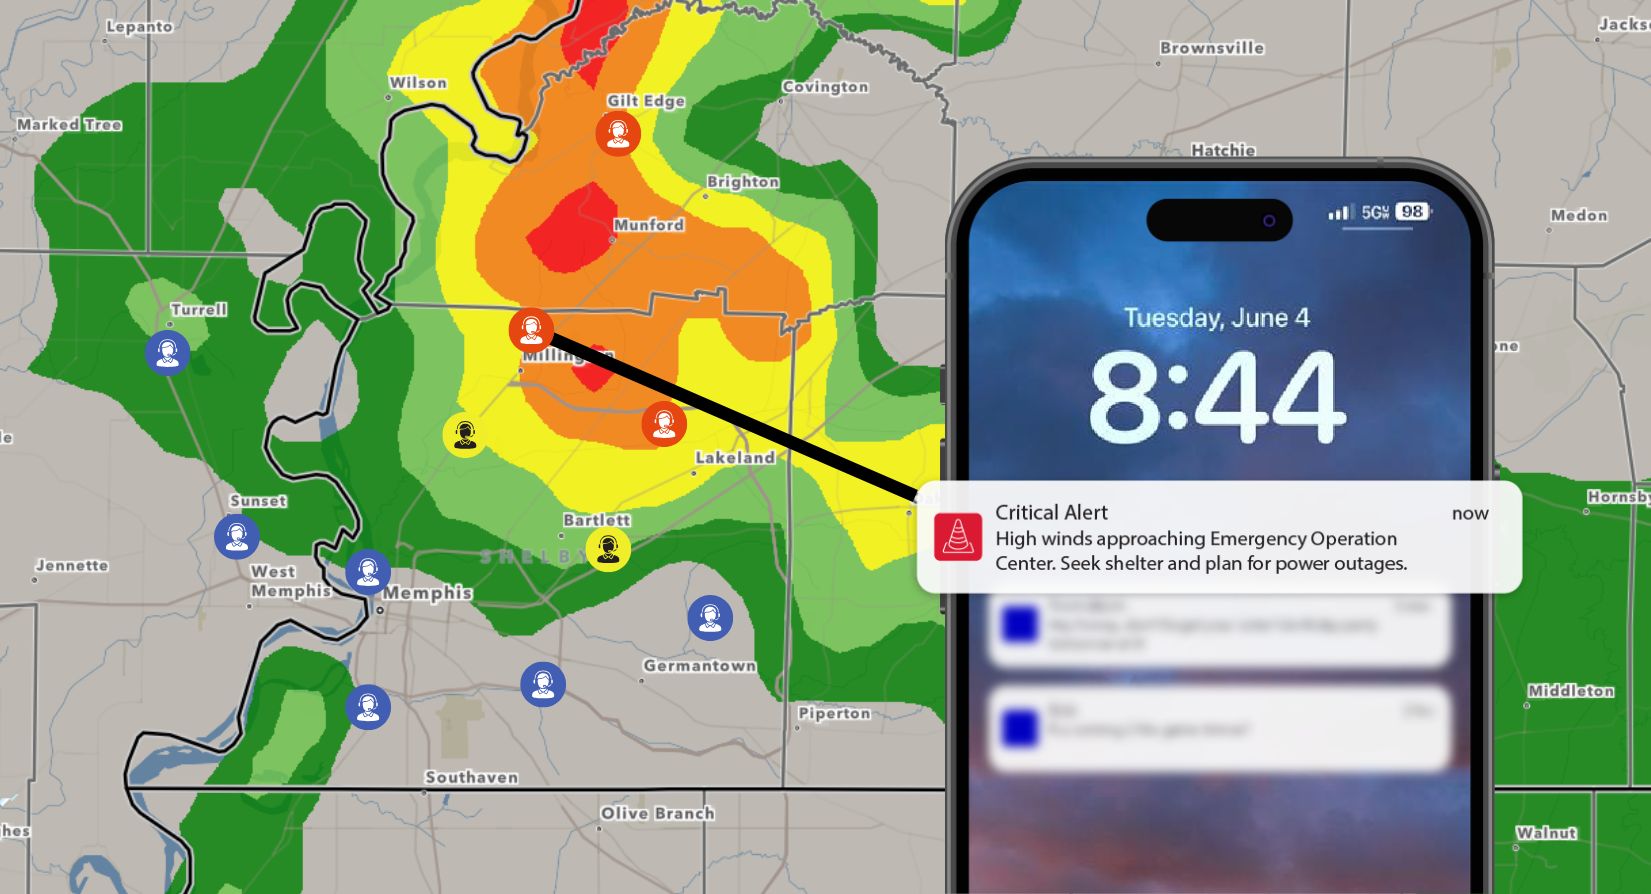
When a storm threatens, lead time is the most valuable resource there is. The difference between an orderly evacuation and gridlocked highways can come down to hours — and those hours depend on how quickly decision-makers receive actionable information and how confidently they can act on it.
That's why advanced alerting is built into Baron's solutions — Weather Logic, ArcGIS Weather Layers, the Baron-branded connector in ArcGIS Velocity, the Baron Weather API, and Baron Threat Net — so when conditions cross a threshold that matters, the right people are notified automatically. When lives and operations are on the line, that lead time makes all the difference.
Within Baron Lynx is also Baron Traffic, where weather data combines with real-time road conditions to give transportation departments and emergency coordinators visibility into how evacuation movement is actually unfolding. Knowing a highway is already congested, or that conditions on a primary evacuation route are deteriorating, changes the calculus of when and how to issue orders.
This phase carries one of the heaviest responsibilities in weather communication — getting clear, actionable, and accurate information to the public in real time. That responsibility falls on broadcasters, emergency managers, PIOs, and organizations of all kinds. How to Prepare for a Hurricane That Hasn't Formed Yet covers how to navigate the tension between early model signals and actionable certainty — a challenge anyone communicating storm information knows well.
Stay Protected During Storms
When a storm makes landfall, the focus shifts from preparation to protection, and the conversation shifts from what's coming to what's happening right now. Situational awareness during the storm matters to responders still in the field, operations teams tracking conditions in real time, and EOCs coordinating response across wide areas.
Baron's solutions don't need to be swapped out when the storm arrives — they transition with it. Weather Logic continues to monitor configured thresholds and push alerts as conditions intensify or shift. Baron's ArcGIS Weather Layers keep updating in near real time, so teams can see exactly where the storm is, what it's doing to infrastructure and communities, and where impacts are moving next. Baron Threat Net gives field teams and emergency coordinators a dedicated storm tracking environment with the depth and detail that matters most during an active event.
One platform, one picture — so teams can stay focused on the situation, not juggling tools.
Use Caution After Storms
The storm passing is not the same as the hazards ending. Post-storm impacts — floodwaters, downed infrastructure, road damage, contaminated water — continue to pose a serious risk in the hours and days that follow landfall. For the organizations responsible for recovery, the question shifts from what might happen to what did happen and where.
Baron's ArcGIS Weather Layers aren't just for forecasting. Datasets like power outage risk, road conditions, and precipitation accumulation don't stop being relevant when the storm passes — they become part of how teams assess what was impacted, where resources are needed most, and how conditions are still evolving.
Post-event analysis is especially powerful when the data is already there. How a GIS Solution Can Elevate Your Hurricane Plan explores exactly that — told through the firsthand experience of an emergency manager who navigated Hurricane Helene's inland flooding and recovery.
This is also where weather data transitions from forecast intelligence to historical record. The Baron Weather API provides access to historical datasets that allow organizations to reconstruct conditions at specific times and locations during a storm — documenting wind speeds at a facility, rainfall totals in a watershed, or when storm surge peaked. That documentation is critical for insurance claims, FEMA reimbursement, infrastructure assessments, and after-action reporting.
Take Action Today
NOAA's final theme is the most direct: take action today. Not when a storm is named. Today.
Hurricane Preparedness Week is a great time to evaluate whether your organization has the weather intelligence it needs and whether the systems in place are configured and ready for the season. Baron works with emergency management agencies, independent meteorologists, utilities, transportation departments, and organizations across dozens of industries to make sure that when a storm threatens, they're not starting from scratch.
Coastal communities like Galveston, TX know this better than most. Take a look at how their Emergency Management team uses Baron to stay ahead of whatever the season brings.
Hurricane season begins June 1. Don't wait for a storm to find out if you're ready.
Talk to an expert today.
