A historic El Niño is already here, and it’s likely headed for the record books. The question isn’t whether this winter will be different. It’s where and by how much.
Our new Baron Weather El Niño Tracker brings it all together: the official El Niño status, long-range forecasts for the season ahead, county-by-county history from past strong El Niño winters, and a Risk Score for counties and major cities.
On Track for Unprecedented Territory
El Niño is the warm phase of ENSO, the El Niño–Southern Oscillation, a natural cycle of warming and cooling in the tropical Pacific that shifts weather patterns around the world, including the U.S. It doesn’t write the forecast, but it can tilt the odds.
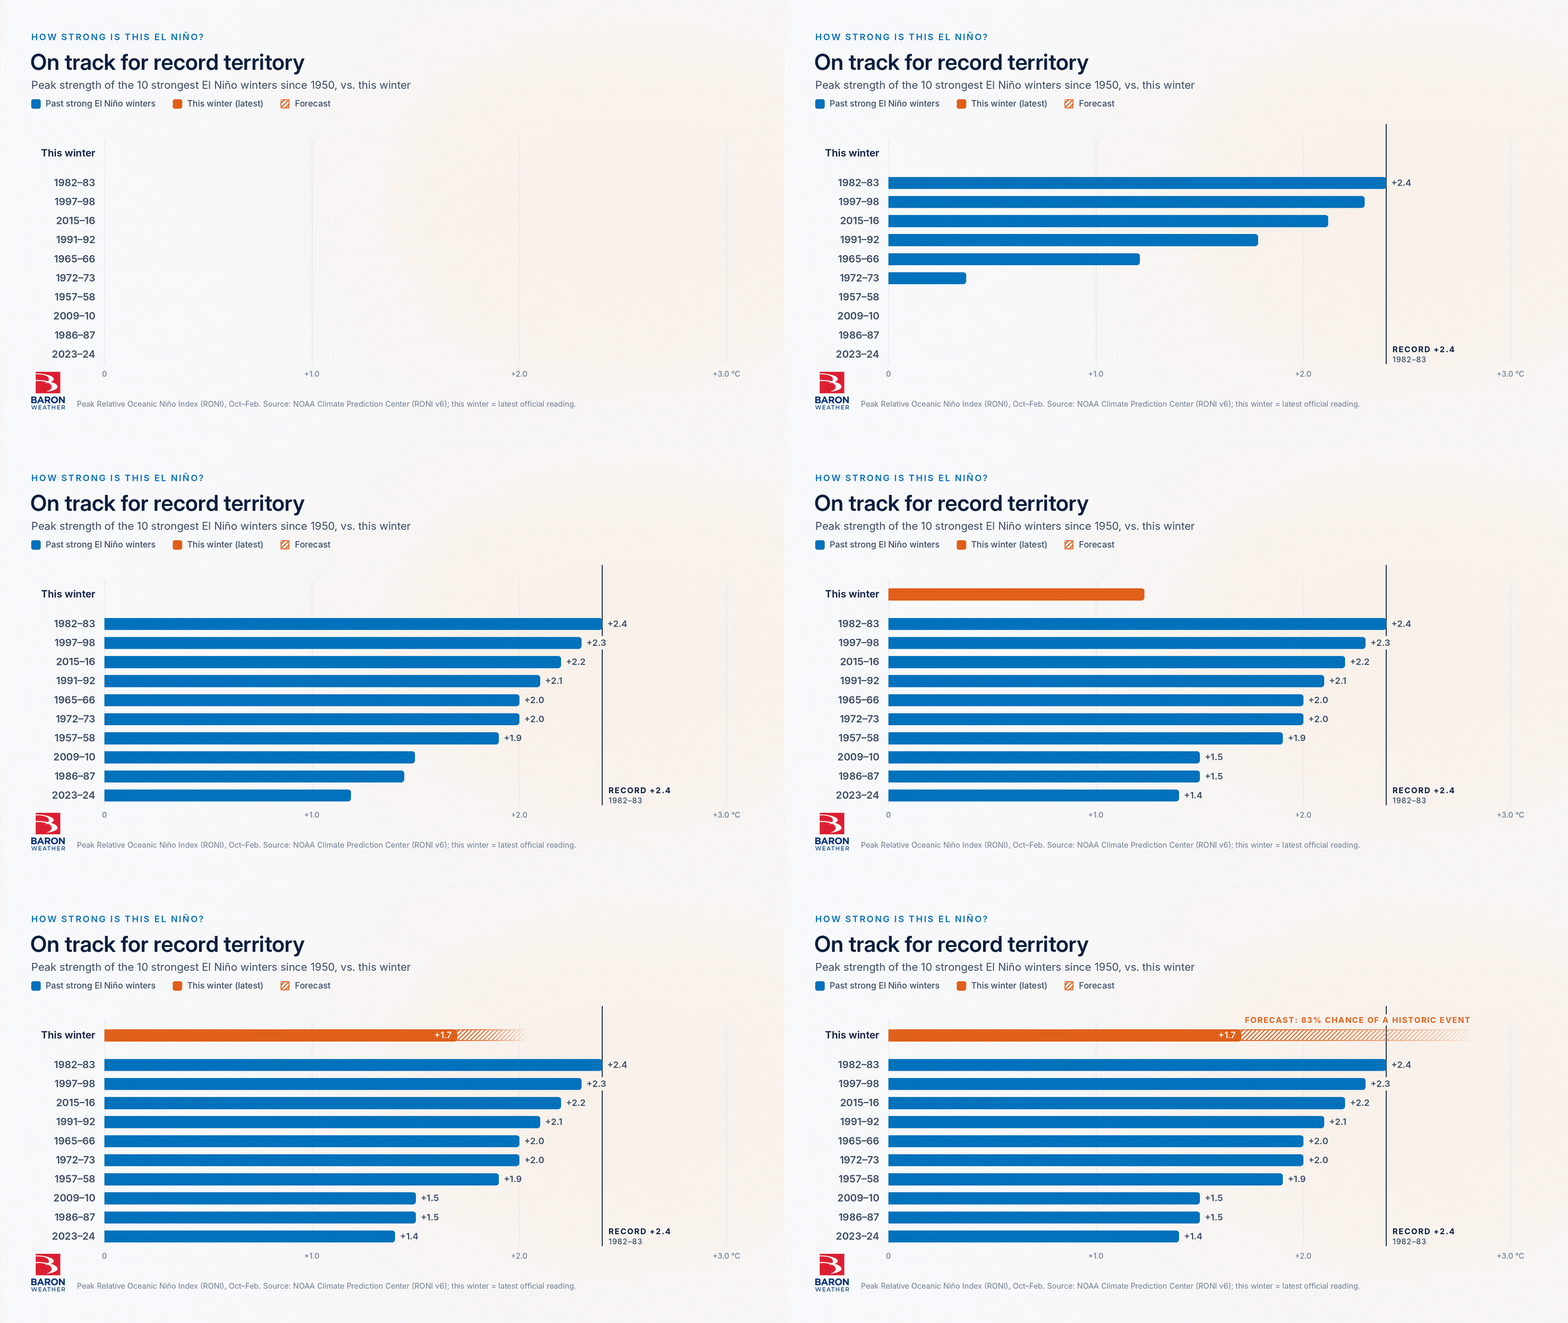
Right now, that tilt is strong. NOAA’s official El Niño index is 1.7, still short of the 2.4 record set in the winter of 1982-83. Forecasters now put the odds of a historic event at 83% this fall, up from 75% a month earlier.
The Tracker’s Status Now page keeps the full picture in one place. It pulls in NOAA’s official readings and outlooks, along with the model plume showing where forecasters expect the index value to go.
What Past Strong Winters Indicate
To gauge the risk ahead, we investigated data from previous winters. We compared the ten strongest El Niño winters since 1950 with every other winter in that span for both temperature and precipitation.
Much of the southern U.S. experienced wetter winters than in other years, with the largest increases in precipitation in the Southwest and Florida. These areas also tend to be cooler due to the extra rain and cloud cover. The region has been wet, with repeated floods fueled by tropical moisture and an October rainfall record tied in Las Vegas.
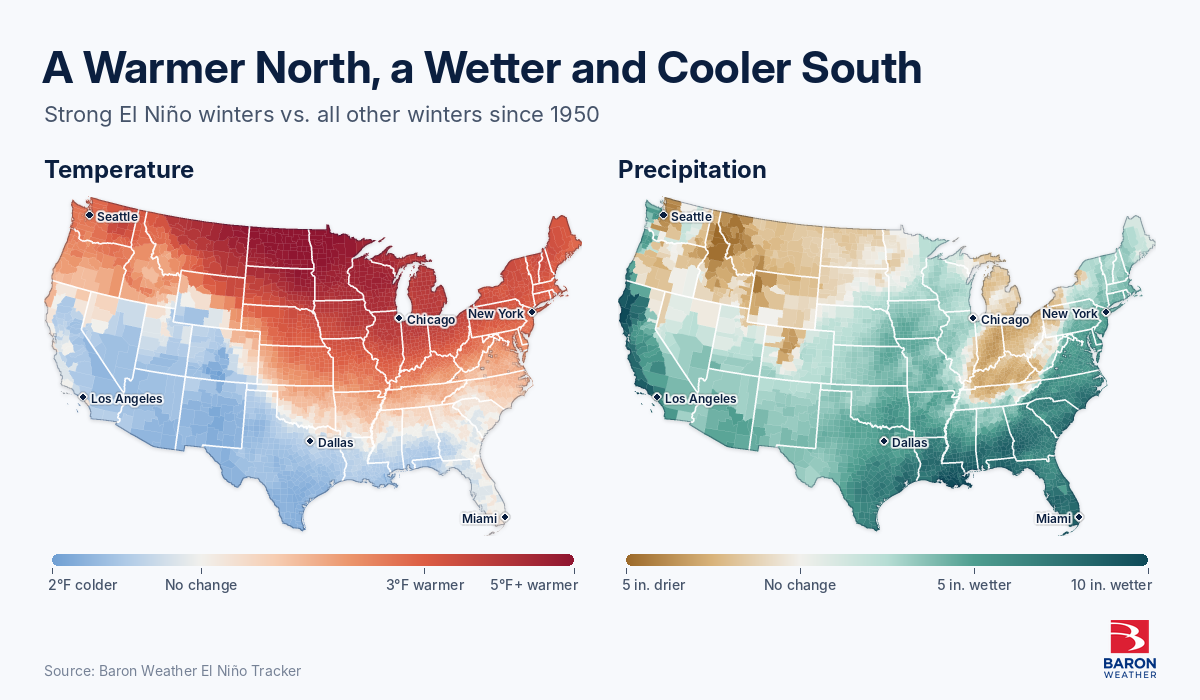
Parts of the northern and eastern U.S. went the other way, leaning toward warmer and drier conditions. The Plains and Midwest have had temperatures running above normal, and drought has started to expand and worsen in those regions.
We ran the same comparison for tornadoes, examining county counts and densities for all tornadoes. Strong El Niño winters have brought the largest change in tornado occurrence to Florida, where all tornadoes and significant (EF2+) tornadoes become more frequent.
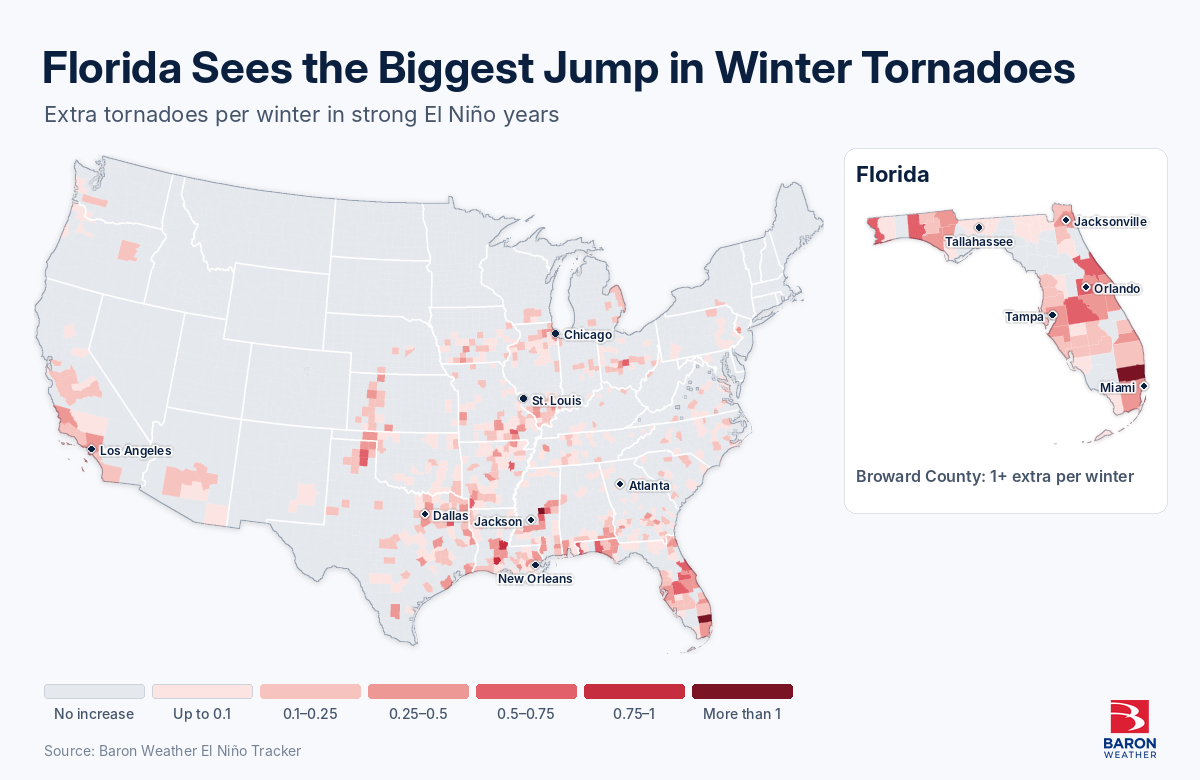
Together, these maps show where the odds have shifted in past El Niño winters. They are useful for deciding where to look first, not a promise of what this winter will do.
Plan Ahead, Check Back Often
The real test for your team is still ahead. The strongest impacts from El Niño usually arrive in December through February, so the next few months will show you how closely this winter follows the historical pattern.
Don’t wait for winter to arrive. Use the Tracker’s Risk Score, which runs from low to extreme, to compare your sites by county or major city and see which need attention first. Then map your operations, assets, and communities against the shifting impacts of past severe winters, and update your plans while there’s still time to adjust.
The Tracker’s status page and current maps update as NOAA releases new information. The official readings, outlook, and odds stay up to date without you having to hunt for them.
Our team is standing by to talk you through what this could mean for your own operations this winter.