Ask most organizations what the last major storm cost them, and they can give you a damage figure. Ask what it costs to respond, and the answer gets less clear. Overtime is buried in payroll. Rerouted trucks show up as fuel costs. Adjusters sent to the wrong county may never appear as a distinct expense.
Those costs are harder to measure, but they are often the ones an organization can reduce. Putting a dollar figure on them helps teams decide where earlier, more specific weather guidance would make a difference.
The Math Behind the Hidden Cost
A starting point for estimating avoidable weather costs is:
Disruptions per year × cost per disruption × share of cost that could be avoided
That is an illustrative estimate, not a promised return. The useful part is identifying the three numbers using your own records and decisions. Each is easy to underestimate for a different reason.
How Often: A Distributor on a Flooded Interstate
Ask a distributor how many weather disruptions it had last year, and the team may remember the major ones: the hurricane, the blizzard, or the week an interstate was underwater. Smaller interruptions can be harder to find in the records.
A two-hour highway closure may never be tagged internally as a weather event. It can still reroute trucks, push drivers toward their hours-of-service limits, and leave dock crews waiting on freight. If similar disruptions happen throughout the year, their combined cost can be substantial.
Baron’s Flood Finder shows which roads are at risk before water reaches them, down to the street level. That gives dispatchers an opportunity to change routes before trucks leave, rather than reacting once they are delayed.
When counting disruptions, include the smaller events. Adding those events may lower the average cost per disruption while revealing a larger annual total. A review of route changes, delays, and closures may uncover weather costs that never appeared in a disaster report.
What It Costs: A Grid Operator Facing an Ice Storm
When a utility totals the cost of an ice storm, equipment damage is often the clearest figure: conductors, poles, and transformers. The full operating cost can be spread across several other budgets.
Overtime appears in payroll. Mutual aid appears in contractor spending. Each additional day of restoration can add labor and customer costs. When those expenses are tracked separately, it is difficult to see what one event actually cost.
Many of those costs depend on decisions made before and during the storm: how many crews to call, where to stage them, and when to request help. Ice accretion and wind forecasts from Baron’s high-resolution model, tied to specific circuits and substations, help utilities scale those decisions to the assets facing the greatest threat.




When calculating the cost per disruption, look beyond physical damage. Include the labor, outside support, downtime, and service impacts that came with the response.
How Much Is Avoidable: An Insurer After a Hailstorm
An insurer cannot prevent hail damage after a storm has passed. But the cost of handling the resulting claims can depend on how quickly the carrier understands where the storm hit.
Without a clear picture of the impact area, adjusters may be assigned based on where claims arrive first rather than where damage is likely to be greatest. Inspections can take longer to prioritize, extending cycle times and leaving policyholders waiting.
Baron’s radar-derived hail swaths, wind swaths, and rainfall totals map the impact area within hours, before claims volume peaks. Overlaid with a carrier’s policy footprint, that information helps teams decide where to send adjusters first and check reported conditions against what the radar observed.


When estimating the avoidable share, focus on the response. Ask which expenses could have been reduced if the team had known sooner where the greatest impacts were.
Putting the Numbers to Work
The calculation is most useful when it leads to a decision. A transportation team may find that frequent, modest delays account for its largest annual weather cost. A utility may find that late crew staging adds more to a major event than expected. An insurer may identify claims handling time as the expense it has the clearest opportunity to reduce.
Baron can help put weather guidance where those decisions happen:
- For dispatch and other established systems, the Baron Weather API delivers forecast, radar, alerting, and storm impact data into operational workflows. A dispatcher can use road risk information while deciding whether to send or reroute a truck.
- For teams working in GIS, Baron ArcGIS Weather Layers place live radar, forecasts, and hazard data alongside their own assets, routes, and policy footprints. A utility can see which substations or circuits need attention; an insurer can compare a storm’s footprint with its policies.
- For teams monitoring specific locations and assets, Weather Logic tracks conditions along with their assets with customizable alerts so the right people are notified when forecast thresholds are close to being crossed. They can act before conditions interrupt operations.
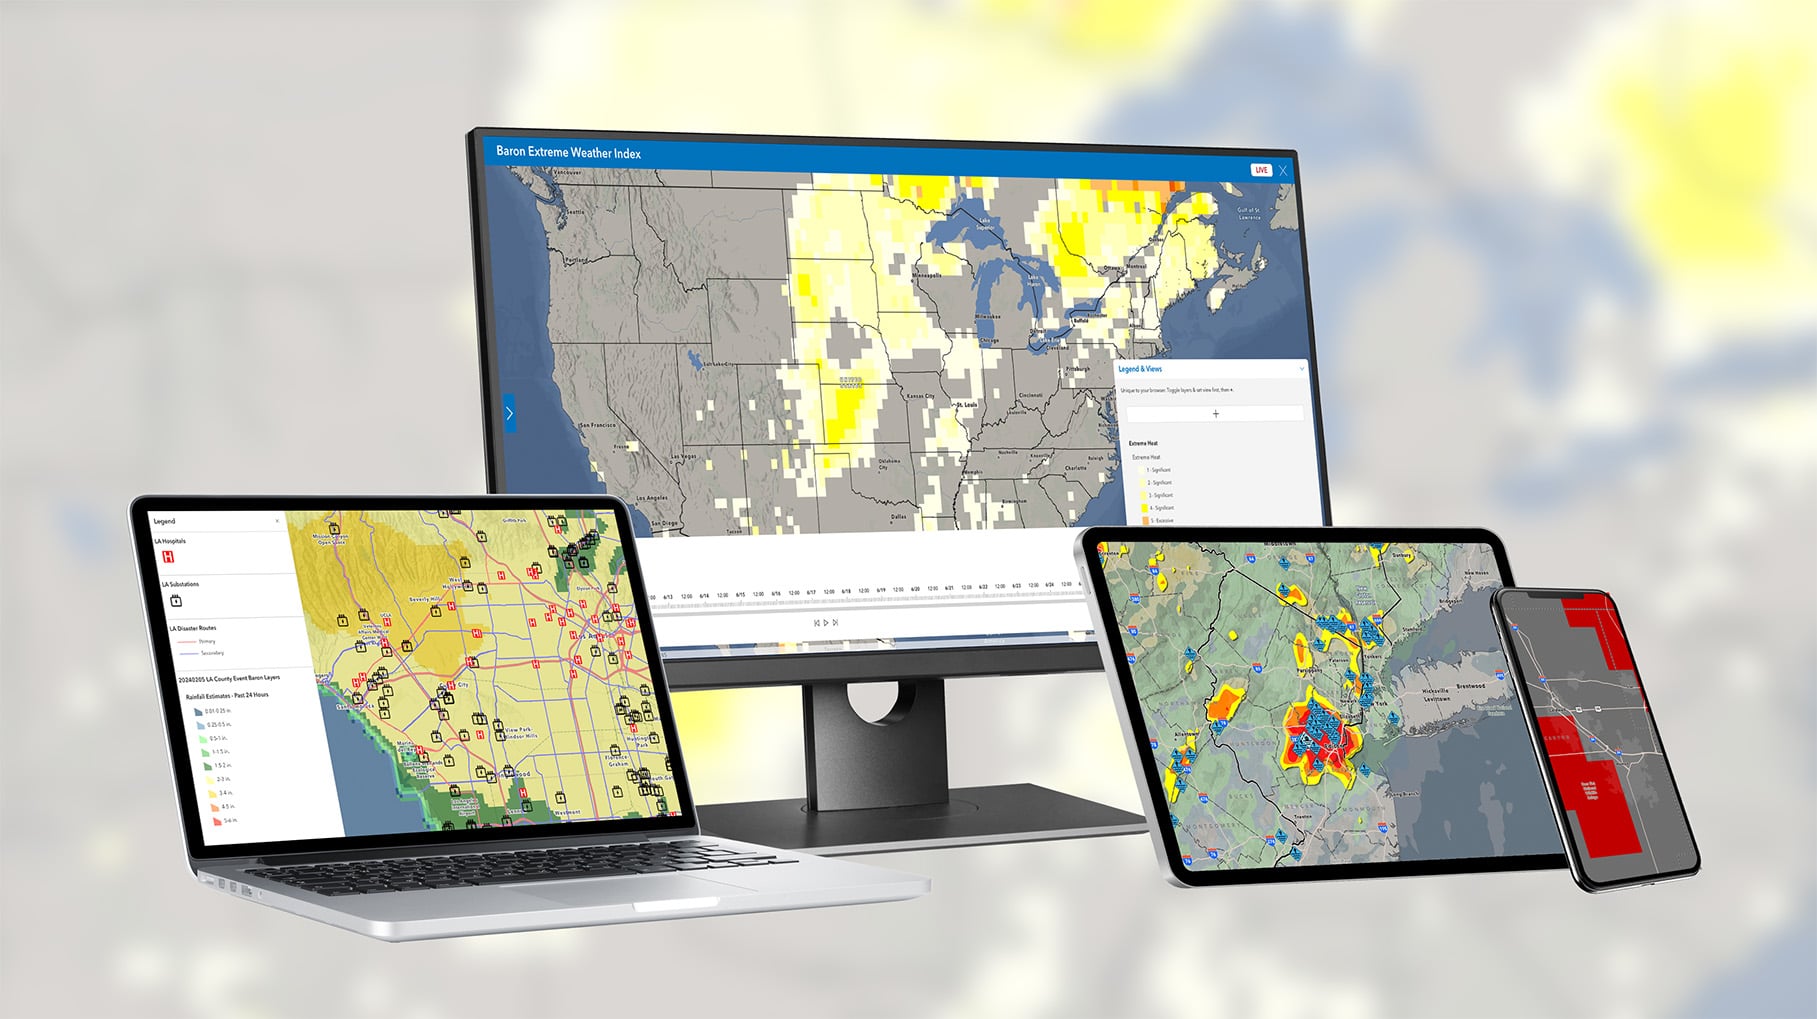
The value comes from pairing guidance with a decision someone can make in time. That is where an estimated avoidable cost becomes an opportunity to change the outcome.
For the broader picture of what extreme weather costs, and why warning time alone does not eliminate those costs, read The Economic Impact of Weather Events: What Disasters Cost, and Where That Cost is Avoidable.
Run Your Own Numbers
Baron’s weather ROI calculator helps you estimate potential savings using your organization’s disruption frequency, cost per disruption, and the share of costs that better weather guidance could help you avoid. It also estimates the staff time your team could reclaim from tracking and reacting to weather.
Start with a recurring weather event and the decisions your team makes when it happens. Consider what earlier, more specific guidance could change compared with the information and processes you use today. The result can help you identify which costs are worth investigating and where Baron’s weather intelligence could have the greatest effect.