Some of the clearest evidence on what warning time is worth comes from watching the same hazard strike the same place twice.
The Texas Hill Country offers that comparison. On July 4, 2025, the Guadalupe River rose 31 feet in 90 minutes. The flooding that followed was one of the deadliest inland flood events in modern U.S. history, and the loss of more than 130 lives is not something the analysis below is meant to reduce to a statistic.
A year later, a similar event happened in almost the same place. In July 2026, a larger portion of the Hill Country experienced torrential rain, up to 20 inches near Kerrville and up to 30 inches near Uvalde, and the Guadalupe rose more than 30 feet in three hours. The storm footprint was bigger than the year before. The state confirmed two deaths.
The geology did not change, and neither did the atmospheric setup. What changed was how much warning people had, and how quickly that warning turned into action. New flood sirens and mobile alerts along the Guadalupe bought enough time to evacuate, and local officials credited those systems directly.
That same gap, between when a threat is known and when it can be acted on, is what drives the economics. A hazard becomes expensive in rough proportion to how little time there is to respond to it, and response time is one of the few variables in that equation that an organization can move.
What Does Extreme Weather Cost?
The standard U.S. measure is the billion-dollar disaster record, which counts weather and climate events causing at least $1 billion in damage, adjusted for inflation. The figures in this section are United States only. No comparable public record exists for most of the world, which is part of the problem addressed later on.
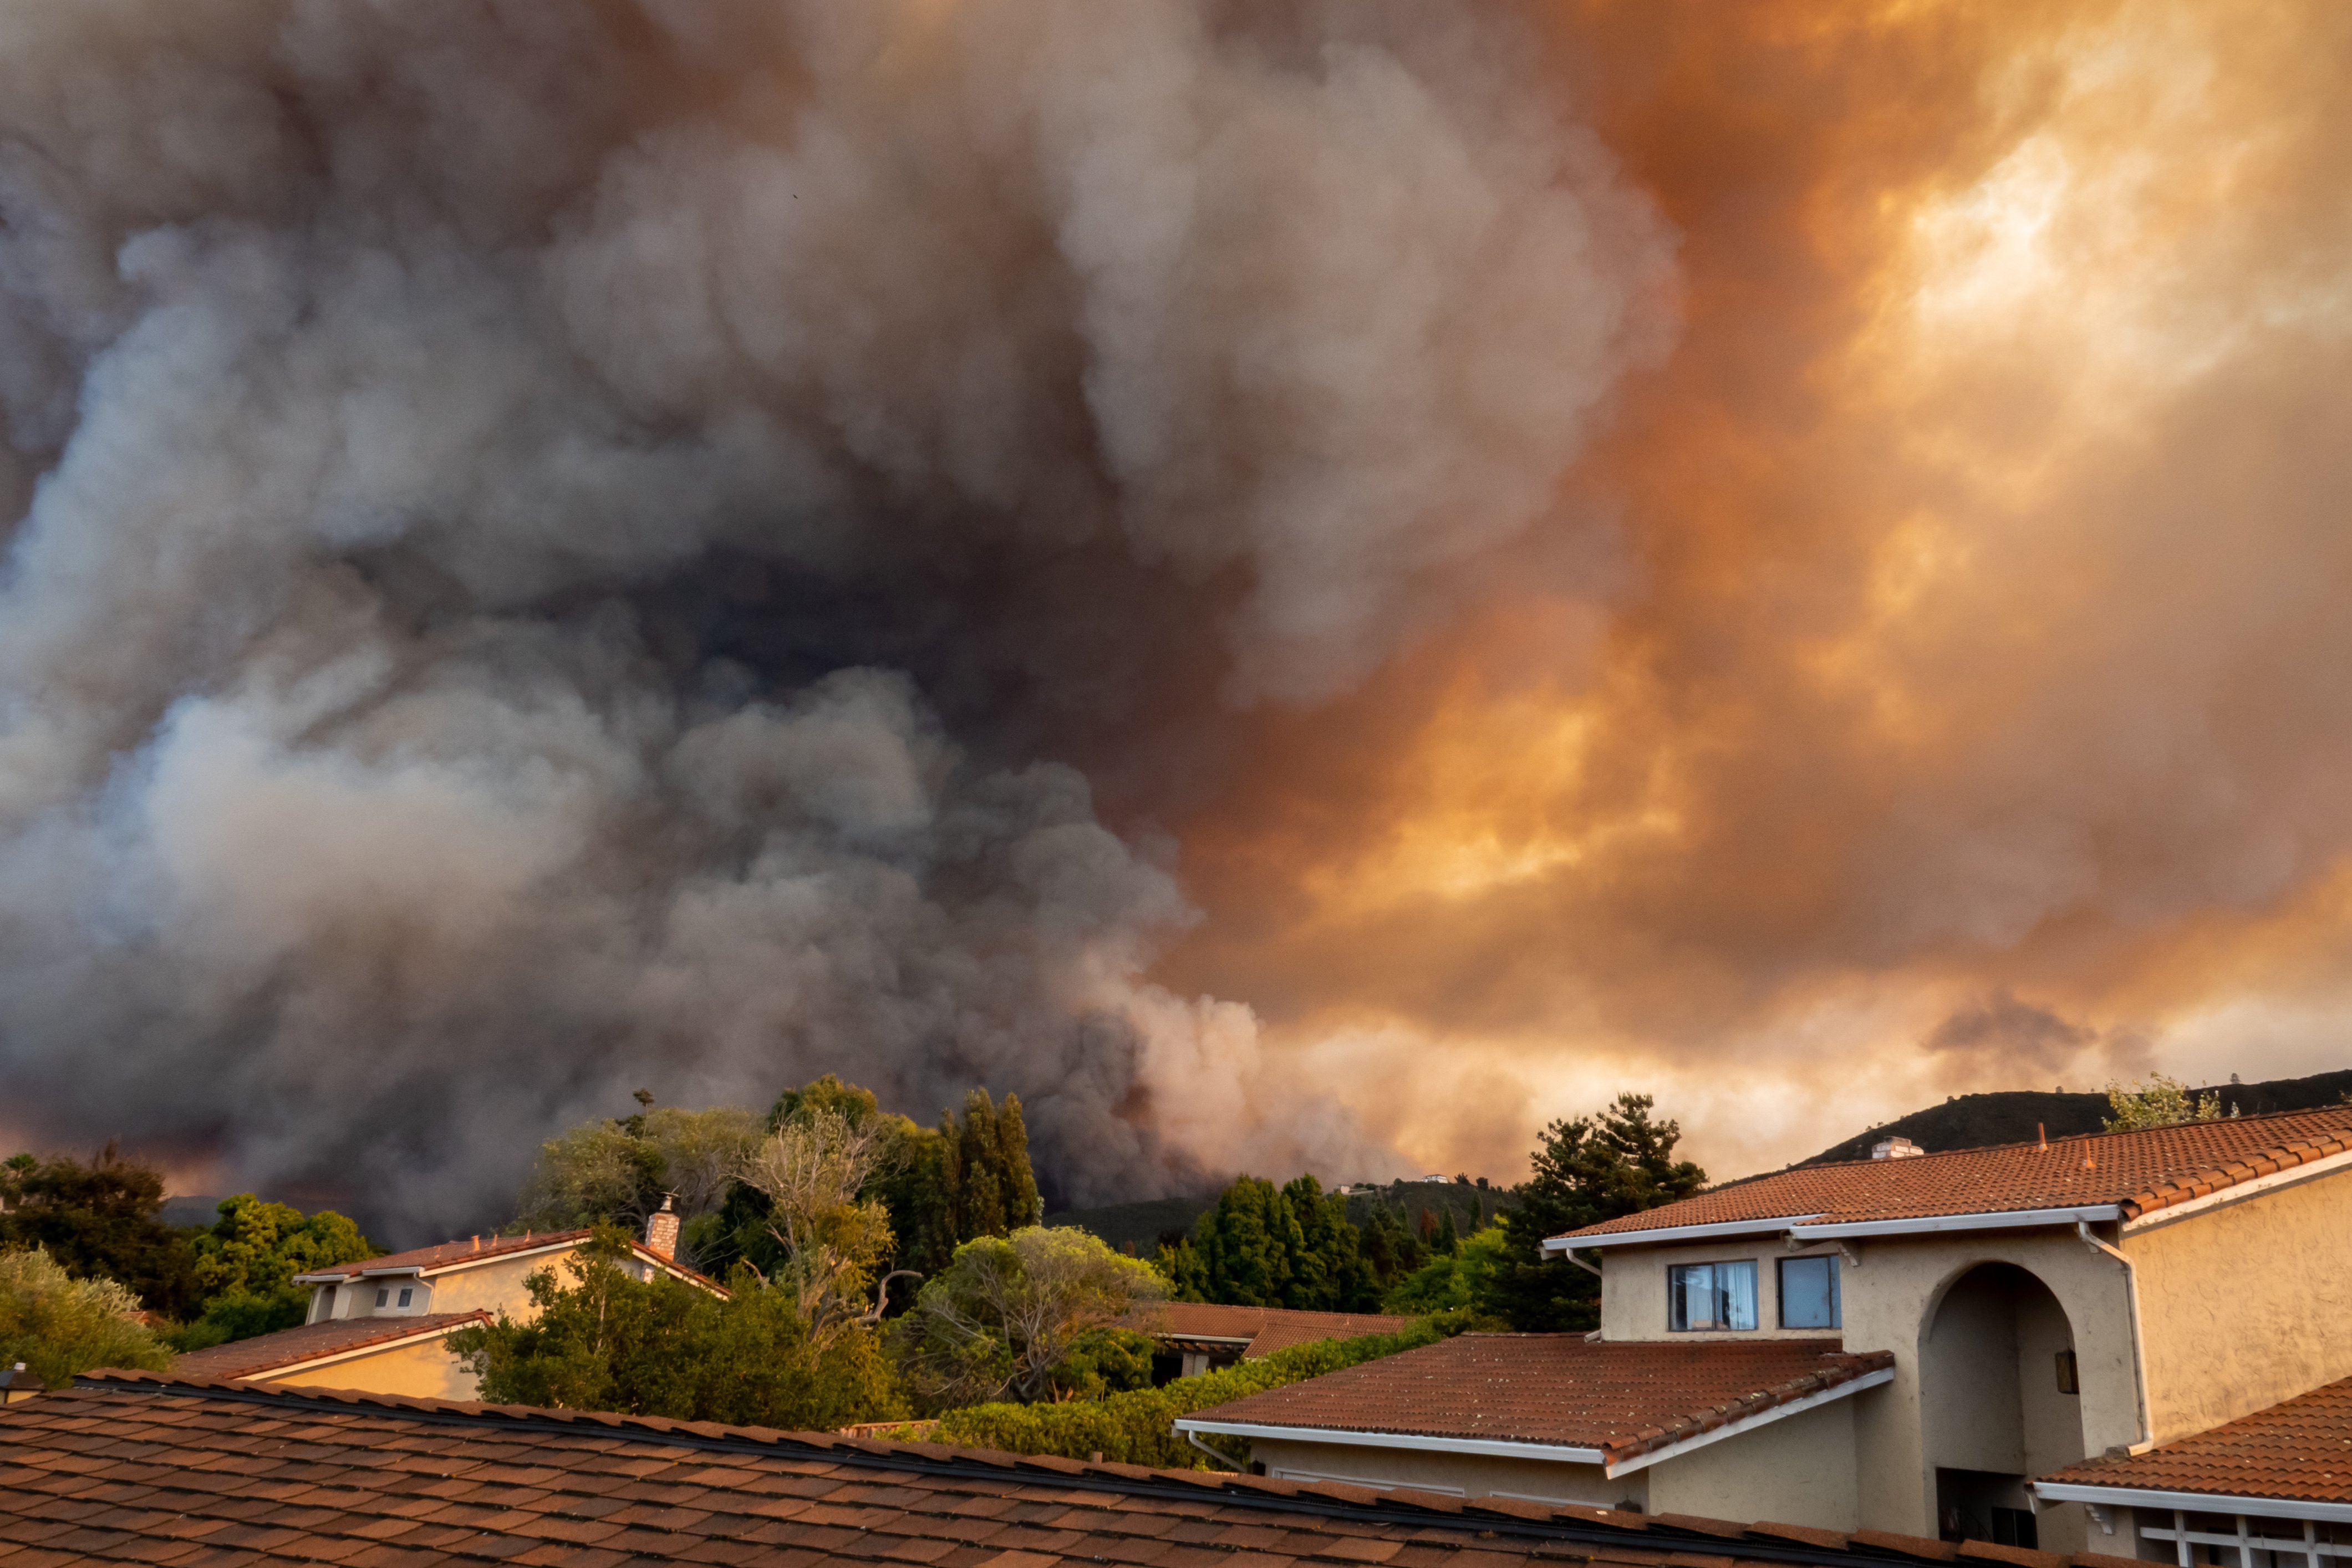
Since 1980, the United States has recorded 426 billion-dollar disasters, at a total cost exceeding $3.1 trillion. The pace has accelerated sharply, and the clearest way to see it is the gap between events. In the 1980s, an average of 82 days separated one billion-dollar disaster from the next. Over the past decade that fell to 16 days. In 2025, it was 10.
2025 itself ranked third, behind 2023 and 2024, with 23 billion-dollar events totaling $115 billion. The January wildfires in the Palisades and Eaton Canyon accounted for $61.2 billion of that on their own, making them the costliest wildfires in U.S. history at roughly twice the previous record. A March tornado outbreak in the central states was the second-costliest event of the year at $11 billion. Notably, the year passed $100 billion without a single landfalling hurricane. For a fuller accounting, see our 2025 extreme weather year in review and the interactive 2025 severe weather report.
A note on sourcing, for anyone building a risk model on these figures. NOAA's National Centers for Environmental Information maintained the billion-dollar disaster product from 1980 through 2024 and retired it in May 2025. Climate Central assumed stewardship in July 2025 and relaunched the database publicly that October, carrying the full archive forward with the same methodology. Records through 2024 remain archived and authoritative at NOAA, and 2025 forward lives with Climate Central. If your organization cites this data in underwriting, capital planning, or resilience reporting, confirm which source your numbers came from.
The Damage Total Understates the Real Loss
Billion-dollar totals capture direct physical damage. Destroyed homes, damaged infrastructure, lost crops. They are deliberately conservative, and they exclude every event that caused less than $1 billion.
What they leave out is most of what a business actually feels.
A regional grid operator's cost from an ice storm is not only the cost of replacing conductors. It is the crew overtime, the mutual aid agreements, the regulatory scrutiny, and the days of restoration. A distributor's cost from a flooded interstate involves no property damage at all. It is a rerouted fleet, missed delivery windows, and idle labor at both ends. An insurer's cost from a hailstorm includes the claims surge itself, with adjusters deployed to the wrong counties and cycle times stretching while policyholders wait.
None of that appears in a disaster loss table, but all of it appears on a quarterly P&L.
The practical question for most organizations is not how expensive a given event was. It is how much of that expense was avoidable, and what would it take to avoid it?
To estimate that cost using your own disruptions, operating expenses, and response decisions, read Quantifying Risk: Turning Weather Data into Dollars with Baron Weather.
How Much of That Cost is Avoidable?
There is a reasonably well-established answer, and it is one of the better-supported figures in disaster economics.
According to the Global Commission on Adaptation, 24 hours of notice ahead of a hazardous event reduces the resulting damage by roughly 30 percent. The same report estimates that investing $800 million in multi-hazard early warning systems across developing countries would avoid $3 to $16 billion in losses per year. The World Meteorological Organization puts the overall return on early warning investment at more than tenfold, and reports that disaster-related mortality runs at least six times lower in countries with functioning systems.
Those numbers are the basis for Early Warnings for All, the initiative launched by the UN Secretary-General at COP27 in November 2022 with the goal of protecting every person on Earth with an early warning system by the end of 2027. WMO and the UN Office for Disaster Risk Reduction co-lead it, with the International Telecommunication Union and the IFRC leading the dissemination and preparedness pillars. WMO has made it the organization's top priority through 2027.
Progress for the initiative is real but uneven. As of the 2025 global status report, about 119 countries, roughly 60 percent, report having a multi-hazard early warning system in place. Least developed countries and small island developing states remain furthest behind, and they are also among the most exposed.
The Texas Hill Country shows what a damage reduction on that order looks like on the ground. The 2026 response reached into Ingram, Kerr, and Kendall counties, none of which had comparable warning infrastructure a year earlier, and 28 additional Texas counties are now eligible for flood warning funding. The hazard in that watershed has not changed in a century. The cost to the people living there is only beginning to come into view.
Lead Time Alone Doesn't Close the Gap
A lot of resilience investment underdelivers for the same reason. Warning time only turns into avoided loss if the warning is specific enough to act on and arrives fast enough to matter.
A county-level flood warning tells a utility that flooding is likely somewhere across 900 square miles. It does not tell them which substations to de-energize, which service roads will be impassable, or where to stage crews so they don't end up on the wrong side of the water. The forecast is right, but not specific enough to drive the decisions that carry the cost.
Speed compounds the problem. Flash flooding is the hardest case and the most consequential one. According to the World Meteorological Organization, flash floods account for nearly 85 percent of all flooding-related fatalities and more than $50 billion in economic losses annually. Conditions can escalate from heavy rain to life-threatening inundation in under an hour, and a warning decision may come down to a five-minute window. Traditional flood modeling runs on fixed cycles and can take hours to produce results. When the threat outruns the model cycle, forecasters end up making warning decisions on the last available run rather than on current conditions.
The 2025 Texas event is a reminder that lead time on its own guarantees very little. The National Weather Service issued a flash flood watch for Kerr County more than 12 hours ahead. It was upgraded to a flash flood warning roughly three hours before the water rose, then escalated to a flash flood emergency, and all of it went out over Weather Radio, emergency management systems, and broadcast. The warning chain worked the way it is designed to. The final alerts still arrived while people were asleep, and there were no sirens at the camps along the river. A year later, there were.
This is where the underlying observation network matters more than the interface sitting on top of it. Radar-derived quantitative precipitation estimates measure what has already fallen, at high spatial and temporal resolution, with no ground sensor network required. Paired with high-resolution precipitation forecasts, those estimates can drive basin-level flood impact modeling on demand, run when conditions warrant, and re-run as they change, at a resolution fine enough to distinguish individual watersheds, road segments, and assets rather than whole counties.
That approach matters most where traditional modeling struggles, in regions with thin or nonexistent stream gauge and soil sensor coverage. Much of the world that Early Warnings for All is trying to reach falls into exactly that category.
How Different Industries Turn Lead Time Into Avoided Cost
The economics look different depending on what you are protecting.
Emergency management: The decision is whether to warn, evacuate, and pre-position, usually on incomplete information and a short clock. Basin-level guidance narrows the uncertainty and widens the window people have to get out safely. The two Guadalupe events, a year apart, show how much that window can change what a flood costs a community.
Utilities and energy: Flood, wind, and ice damage to substations and distribution infrastructure is largely a pre-positioning problem. Knowing which assets sit inside the threat footprint hours ahead rather than minutes changes where crews stage, how long outages last, and what restoration costs. It also keeps crews out of conditions they should not be driving into, which matters well beyond the balance sheet.
Transportation and logistics: Road closures, rail disruption, and bridge failures follow flash flooding with very little warning. Location-specific impact guidance supports proactive rerouting instead of reactive detours, and the savings show up in fuel, labor, and service-level performance rather than in property damage.
Insurance: Weather intelligence touches underwriting, catastrophe response, and claims. Radar-derived hail swaths, wind swaths, rainfall totals, and storm reports help teams identify likely impact areas before claims volume peaks, prioritize inspections, and validate reported conditions afterward. Our buyer's guide to evaluating weather intelligence for insurance covers what to look for across that lifecycle.
Agriculture and construction: The cost here is mostly labor and scheduling. Crews idled, pours ruined, harvest windows missed. Thresholds matter more than headline forecasts, because the call is usually whether to work today, not whether to evacuate.
National hydrological and meteorological services: The constraint is frequently infrastructure rather than expertise. Modeling that requires only radar and forecast inputs can extend flood guidance into areas where building out a ground sensor network is not realistic on any near-term budget.
Five Questions to Ask About Your Own Exposure
Most organizations have a rough sense that weather costs them money and very little sense of how much of it is avoidable. The following questions can help organizations surface the gap.
How much notice do you get from your own systems, not from a public warning? Public alerts are issued when a threat crosses a threshold for the general population. If that is the first thing your team hears, you are starting the clock at the same moment as everyone else, including the people you serve.
Is the guidance specific enough to name an asset? A county-level warning and an asset-level warning cost the same to receive and produce very different decisions. If your team cannot tell from the guidance which substation, route, or site is in the path, the lead time you have is worth less than it looks.
What does one disruption cost, counting labor and downtime rather than damage? Most organizations can produce a damage figure, but cannot produce this one. It is usually the larger number, and it is the one more notice moves. Our weather ROI calculator is built to work through that figure on your own inputs.
Who makes the call, and do they have the guidance in hand when they make it? Lead time is lost in handoffs as often as in modeling. If the information reaches an analyst who then has to reach a decision maker, count that gap as part of your response time.
What happens when conditions change faster than your data refreshes? This is the question that separates organizations with a plan from organizations with a subscription. If the answer is that your team waits for the next scheduled update, you have found the ceiling on your lead time.
Working through these honestly tends to produce one of two answers. Either the warning time is there, and the response process is the constraint, or the response process is sound, but the guidance is too coarse or too slow to act on. Both are fixable, but they require different fixes.
Where the Cost is Avoidable
Weather is not getting more expensive only because storms are changing. It is getting more expensive because more value sits in the path. More homes in the wildland-urban interface, more infrastructure in floodplains, and more supply chain concentrated in fewer corridors.
Organizations cannot change the hazard. They can change how much of it converts into loss, and the evidence on that holds at every scale, from a national hydrological service covering a country with no sensor network to a utility deciding which substation to protect tonight.
The question worth asking is not only how accurate your forecast is. It is whether that forecast tells you, in time, which of the things you are responsible for is about to be affected.
Frequently Asked Questions
What is the annual economic cost of extreme weather in the United States? Since 1980, the U.S. has recorded 426 disasters causing at least $1 billion in damage each, totaling more than $3.1 trillion. 2025 alone produced 23 such events totaling $115 billion, the third-costliest year on record. These figures cover the United States only, count direct damage only, and exclude events under $1 billion.
Who maintains the U.S. billion-dollar disaster database now? NOAA's National Centers for Environmental Information retired the product in May 2025. Climate Central assumed stewardship that July and relaunched the database in October 2025, continuing it with the same methodology. Data from 1980 to 2024 remains archived with NOAA.
How much can early warning systems reduce disaster losses? The Global Commission on Adaptation estimates that 24 hours of advance notice reduces damage by about 30 percent. WMO puts the overall return on early warning investment above tenfold and reports that disaster mortality runs at least six times lower in countries with functioning systems.
What is the Early Warnings for All initiative? A UN initiative launched at COP27 in 2022, co-led by WMO and UNDRR, with the goal of protecting everyone on Earth with a multi-hazard early warning system by the end of 2027. As of the 2025 status report, roughly 119 countries reported having one in place.
Why is flash flooding treated separately from other flood risks? Because the decision window is shorter. Riverine flooding often develops over days. Flash flooding can develop in under an hour, which means warning decisions have to be made faster than most modeling cycles' refresh.
Does better flood modeling require ground sensors? Not necessarily. Approaches built on radar-derived precipitation estimates and high-resolution forecasts can produce basin-level flood guidance in regions without stream gauge or soil moisture networks, which is a significant part of the global coverage gap.
Sources
Climate Central. U.S. Billion-Dollar Weather and Climate Disasters. https://www.climatecentral.org/climate-services/billion-dollar-disasters
Climate Central. (2026). 2025 in Review: U.S. Billion-Dollar Disasters. https://www.climatecentral.org/climate-matters/2025-in-review
NOAA National Centers for Environmental Information. Billion-Dollar Weather and Climate Disasters (archive, 1980-2024). https://www.ncei.noaa.gov/access/billions/
NOAA NESDIS. (2025). Notice of Changes: Billion-Dollar Weather and Climate Disasters. https://www.nesdis.noaa.gov/about/documents-reports/notice-of-changes/2025-notice-of-changes/billion-dollar-weather-and-climate-disasters
Global Commission on Adaptation. (2019). Adapt Now: A Global Call for Leadership on Climate Resilience. https://gca.org/reports/adapt-now-a-global-call-for-leadership-on-climate-resilience/
World Meteorological Organization. (2025). Devastating floods highlight need and challenges for warnings. https://wmo.int/media/news/devastating-floods-highlight-need-and-challenges-warnings
World Meteorological Organization. Early Warnings for All. https://wmo.int/activities/early-warnings-all
Keller, C.L., & Boone, R. (2026). Texas Hill Country floods test new warning systems after last year's deadly disaster. Associated Press via PBS News. https://www.pbs.org/newshour/nation/texas-hill-country-floods-test-new-warning-systems-after-last-years-deadly-disaster
Brahler, M., & Huffman, J. (2026). One Year Later, Texas Hill Country Applies Lessons from 2025 Floods. Baron Weather. https://baronweather.com/extreme-weather/one-year-later-texas-hill-country-applies-lessons-from-2025-floods
Huffman, J. (2026). 2025 Extreme Weather Year in Review. Baron Weather. https://baronweather.com/extreme-weather/2025-year-in-review
_______________________________________________________________________________
Baron Weather is a global weather intelligence company serving broadcast media, enterprise organizations, and government agencies worldwide. Our solutions span the full spectrum of weather technology — from physical weather radar systems and proprietary weather modeling platforms to real-time data, analytics, and decision-support tools. Whether protecting on-air broadcasts, enabling operational decision-making for large enterprises, or supporting the forecast and warning missions of government agencies and meteorological services around the world, Baron brings together the depth of science and the precision of technology.