Most teams responsible for physical assets already operate in a GIS — their sites, territories, and infrastructure are mapped.
Weather data, however, often sits somewhere else: a forecast feed, an alerting service, a browser tab. Neither, on its own, can answer the key question when a storm approaches: which of our assets are in its path? Connecting those dots usually falls to someone under time pressure, often by hand.
That missing connection is the layer that transforms operations. Not a new platform or full system overhaul, but real-time weather brought directly into the GIS you already use, so assets and conditions share the same map. That is location intelligence: making the relationships visible before conditions deteriorate and your options narrow.
What is location intelligence, and where does the weather fit in?
Location intelligence is the practice of layering data onto a map so patterns and relationships that aren't obvious in a spreadsheet become clear spatially — which properties sit in a floodplain, which circuits run through high-wind corridors, which shipping routes cross a storm track. It runs on a geographic information system (GIS), and for most large organizations, that system is ArcGIS: infrastructure, parcels, customers, and assets, all managed as layers on the same map.
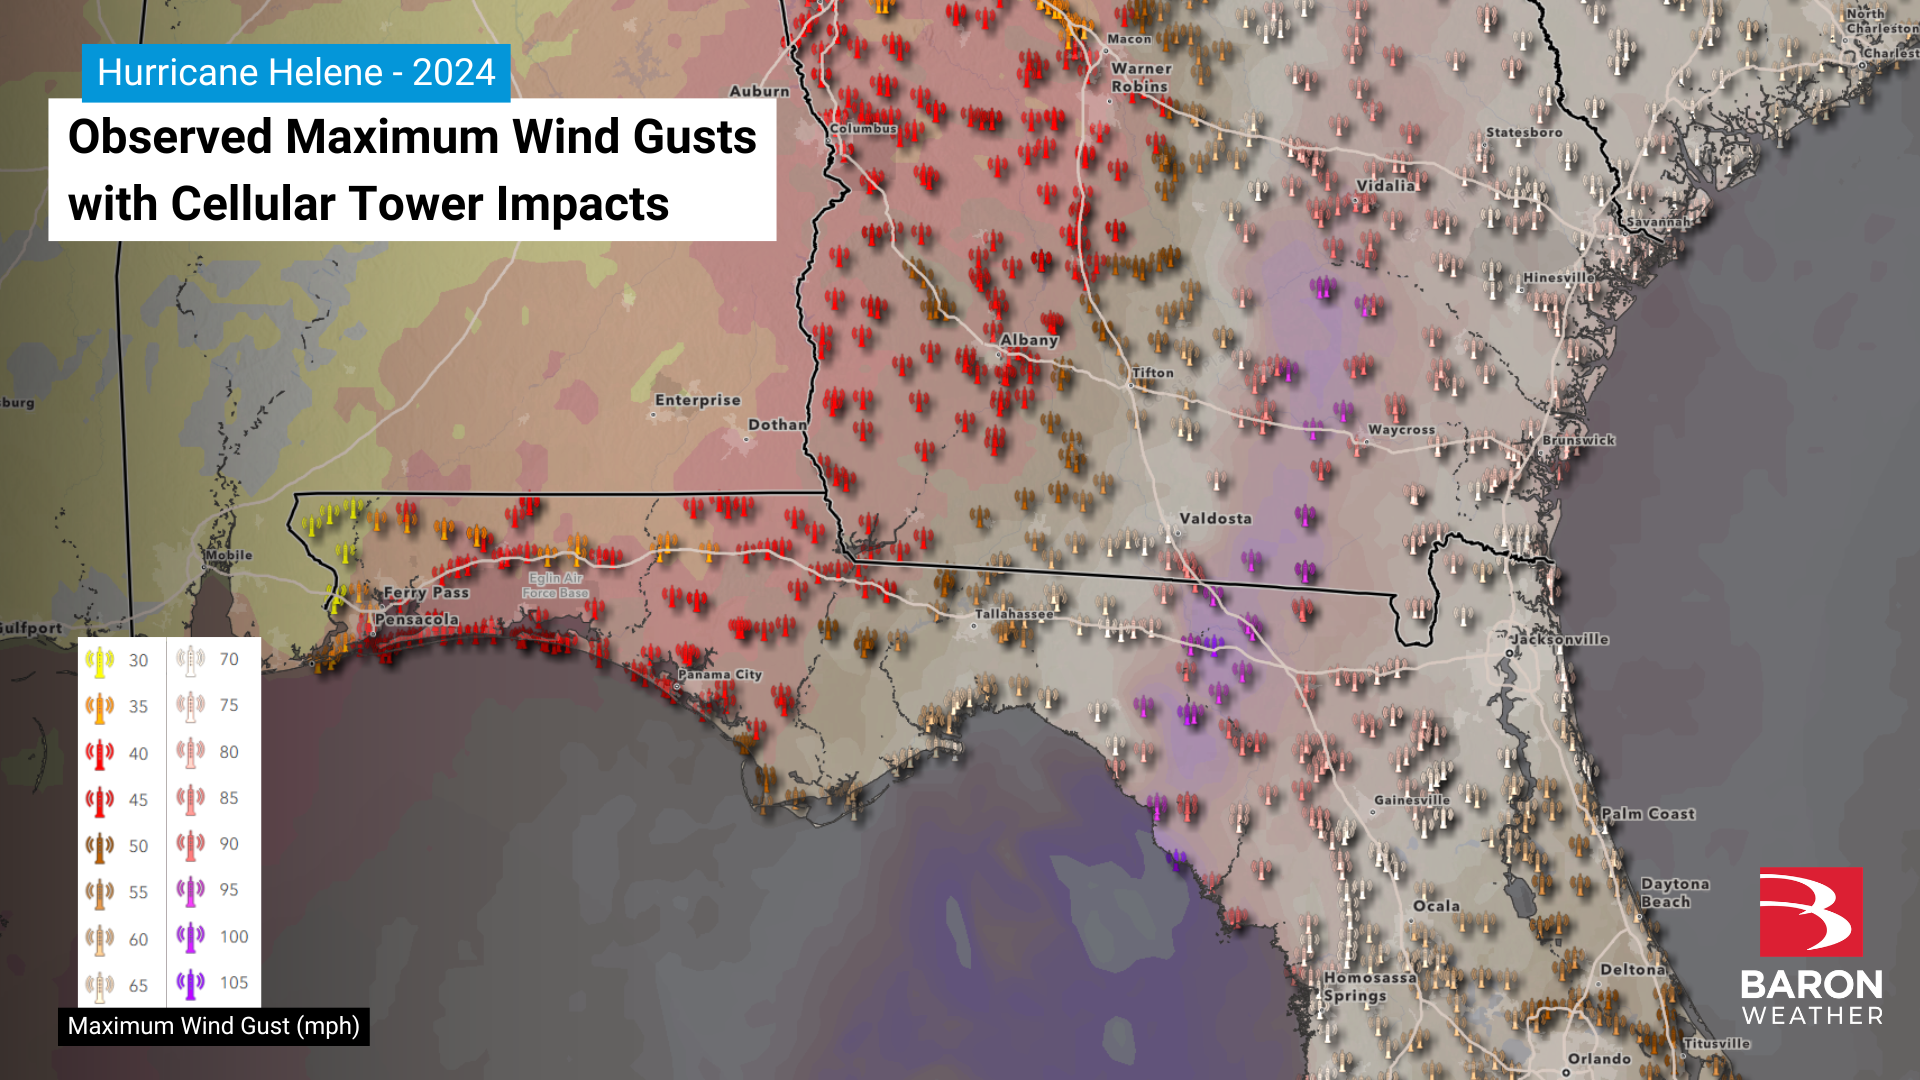
Weather has historically been the layer that lives outside that picture — a separate forecast, a separate alert, a separate screen. Bringing it into the GIS as a native layer changes the questions an operations team can ask. A forecast alone answers "what is the weather going to do?" A weather layer sitting on top of an asset map answers "what is the weather going to do to this" —and that second question is the one that truly drives risk management.
How does weather-driven risk modeling work inside a GIS?
The mechanics vary by sector, but the pattern is consistent: take a weather model, resolve it down to the asset or parcel level within the GIS, and attach a decision threshold to it so a forecast doesn't just get read — it triggers a specific, predefined response.
The Department of Energy's Argonne National Laboratory offers a useful, publicly documented illustration. Its GATOR-FIRE tool integrates radar data with NOAA's High-Resolution Rapid Refresh forecast model inside a GIS platform to identify and study wildfire propagation, providing near-term risk assessment with forecasting, analysis, and real-time monitoring. The same architecture — weather data layered against asset and terrain data, with thresholds that separate normal conditions from elevated ones — now appears across sectors far beyond wildfire research.
National Fuel Gas Company shows what this looks like in production. The company operates more than 2,200 miles of transmission pipeline across New York and Pennsylvania, and federal pipeline safety regulations require inspections to begin within 72 hours of an extreme weather event. Historically, deciding where those inspections were needed relied on employees' individual judgment about local rainfall, which meant inspection areas could be over- or under-assigned. Its modernized system streams live rainfall accumulation radar from Baron through ArcGIS GeoEvent Server, with a geofence drawn around each town in its operating territory. When a rainfall polygon that exceeds a defined threshold intersects a town's geofence, the system automatically notifies the staff responsible for that area — so inspections are focused on the areas where severe rain actually fell, not on someone's best guess.
Utility wildfire mitigation frameworks clearly demonstrate the need. These plans map high-risk areas by combining GIS data, terrain analysis, and historical ignition data, then layer wind, humidity, and temperature forecasts on top to classify each operating day as normal, elevated, or extreme — with pre-defined operational responses tied to each level, from additional field patrols to equipment setting changes to preventive shutoffs. Risk in these frameworks is typically modeled at the individual asset level and then rolled up: reliability risk as the product of failure probability and consequence, fire risk as the product of ignition probability, growth potential, and vulnerability, with weather feeding both calculations.
The resolution of these models keeps improving. Current implementations range from feeder- and circuit-level risk in the utility sector to parcel-level risk in insurance, down to individual pole and equipment-level risk in the most advanced utility programs. The finer the resolution, the more specific the response can be — and the less time an operations team spends deciding whether a broad regional warning applies to the asset in front of them.
How is location intelligence changing risk management across industries?
Energy and utilities are furthest along, largely because the risks come from every direction — and every miss carries real cost, in repairs, crew time, and outage hours. Severe storms bring the wind and lightning that cause most outages; ice accumulation snaps lines under added weight; extreme heat drives demand spikes while stressing the same equipment expected to carry them; extreme cold threatens generation and fuel supply at exactly the moment load peaks; and flooding puts substations and access roads underwater when crews most need to reach them. Each of those risks is spatial — it hits specific circuits, specific substations, specific service territory — which is why utilities have moved weather from a screen someone watches to a layer on the operational map. In wildfire-prone states, that shift has gone furthest, with mitigation planning now a formal regulatory filing category and weather-informed situational awareness treated as a defined line of defense alongside physical hardening.
Insurance and catastrophe modeling are close behind, because underwriting has always been a location-first discipline: the question of what a specific address is worth in a specific storm is inherently spatial. The industry has long leaned on government flood zone maps and historical loss data, but those sources are built from past events, not live conditions — and Hurricane Helene made the gap visible in 2024, when severe inland flooding hit properties that sat almost entirely outside FEMA's mapped high-risk zones. Carriers are increasingly supplementing static sources with live and forecast weather data layered onto policy footprints at the parcel level, so underwriting and claims teams can see which properties are in a storm's path before loss reports arrive.
Emergency management and public safety saw the other side of Hurricane Helene — and arguably the strongest demonstration yet of what location intelligence does when it's in place before the weather arrives. Unlike the static flood maps in the insurance example, North Carolina's Flood Inundation Mapping and Alert Network (FIMAN) combines live stream gauges with forecast data inside a GIS, translating a regional rainfall forecast into specific, mapped flood impacts. During Helene, that forecast data was used to position emergency management teams — including search-and-rescue personnel — in the areas expected to be hit hardest, with teams moving people out of harm's way two days before the storm crossed into the state. The same pattern extends across public safety: evacuation modeling that combines population data with storm-track uncertainty, school and event closure decisions tied to mapped lightning and wind thresholds, and damage assessment that starts from a map of where the worst conditions actually occurred rather than a countywide guess.
Transportation and logistics apply the same model to routes instead of fixed assets: wind, icing, and precipitation forecasts overlaid on shipping lanes, rail corridors, and delivery routes, so dispatchers can reroute around a developing hazard rather than react to a delay already in progress.
The assets don't have to be fixed at all. At the 2026 Esri Energy Resources GIS Conference, Esri's plenary demonstration of ArcGIS Velocity for Enterprise showed the integration working when the assets themselves are moving: Baron wind data combined with live helicopter locations and crew information for offshore platform operations, so operators could see current conditions against aircraft positions as both changed in real time. See how this workflow was demonstrated at ERGIS in our blog, Featured at ERGIS: When Weather Meets Workflows.
Aviation and agriculture adopt the pattern at their own resolutions — runway-specific wind and icing risk, and field-specific frost and precipitation timing.
None of these industries lacked weather data before. What many still lack is a way to ask the forecast a spatial question — which of our assets does this affect — and get an answer fast enough to act on. That's the shift location intelligence delivers: the intersection of weather and operations, on one map.
What does it take to put weather data inside ArcGIS?
Getting weather data into ArcGIS takes less work than it used to. Weather data providers now deliver data as standard ArcGIS-native formats — map services and feature layers that plug into ArcGIS Online, Portal for ArcGIS, and ArcGIS Pro the same way any other layer does. Baron, an Esri Gold Partner, delivers its radar, forecast, and severe weather data this way through its ArcGIS Weather Layers, and as of 2026, Esri customers can purchase Baron's weather data products directly through Esri rather than managing a separate vendor relationship.
The practical consequence is that the heavy lift — producing the weather data, keeping it current, and delivering it in ArcGIS-ready formats — happens on the provider's side. What remains for a GIS team is work they already know how to do: adding a layer to a map and defining the thresholds that matter for their own assets. Once those thresholds are in place, organizations can also automate weather monitoring and notifications within ArcGIS. Read Automating Weather Alerts in ArcGIS with Baron Weather Data to learn how ArcGIS Velocity and Baron Weather Data work together to automate weather alerts and operational workflows.
Do you need a GIS specialist to manage weather risk this way?
Not for day-to-day use. The specialist work in weather-informed risk management has historically been in the pipeline — acquiring the data, formatting it, and keeping it up to date on the map. When weather arrives as a prebuilt native layer, that work is done up front. Reading the map, setting thresholds, and knowing what to do when a threshold is crossed for a specific pole, parcel, or route is operational knowledge that the risk team already has. The GIS becomes the place where that knowledge gets applied faster, not a new discipline to learn. For a closer look at how ArcGIS-ready weather data empowers GIS and operations teams, read You Don't Need a Meteorologist to Use Weather Data in ArcGIS.
What's next for weather-informed risk management?
The trajectory across every sector above points in the same direction: weather is becoming a default layer in the operational map rather than an external feed someone checks. Regulatory pressure is reinforcing it — federal pipeline safety rules requiring inspections within 72 hours of extreme weather events, scrutiny of catastrophe models, and infrastructure resilience requirements all increasingly assume that an organization can demonstrate asset-level weather risk awareness, not just regional awareness.
What that trajectory doesn't change is the thing underneath it: a weather layer is only as good as the data feeding it. A layer built on low-resolution model output or radar with coverage gaps produces a precise-looking map of an imprecise risk. As location intelligence becomes the standard way risk teams work, the differentiator isn't the map — it's the accuracy, resolution, and timeliness of the data on it when the decision matters.
Frequently Asked Questions
What's the difference between location intelligence and a weather forecast?
A forecast tells you what the weather will do. Location intelligence connects that forecast to specific mapped assets — so the output isn't "high winds expected in this county" but "these specific circuits, properties, or routes are in the path." Learn more about how live weather data in ArcGIS transforms forecasts into operational intelligence in How Live Weather Data Becomes More Valuable Inside ArcGIS.
Do I need a GIS system already in place to benefit from weather layers?
To derive the most insights from weather layers specifically, yes — a layer needs a GIS platform to live in, and the value comes from combining it with the spatial data an organization already manages there: infrastructure records, vegetation data, outage history, service territories. ArcGIS is the most common platform for this, and weather layers built as native ArcGIS services integrate without custom development work. But location-based weather monitoring itself doesn't require owning a GIS. Cloud-based decision support platforms — Baron's Weather Logic is one example — combine maps, asset data, and threshold-based alerting in a standalone tool, so an organization can monitor weather against its specific locations without a GIS investment. The right fit depends on your operations' needs.
What kinds of weather data can be layered into ArcGIS?
Modern weather layers cover far more than radar: real-time and forecast data for wind, precipitation, lightning, temperature, and severe storm tracking, along with road conditions, tropical tracking, and historical datasets for after-the-fact analysis. Layers arrive as standard ArcGIS map and feature services, so they behave like any layer already on the map. Baron has created a Data Discovery experience site that showcases all of our weather layers.
How is location intelligence used in severe weather response?
Emergency managers and operations teams use it to move from regional awareness to specific action: overlaying a storm's track and intensity data on population, infrastructure, and evacuation zone layers to see which specific areas and assets are in the path, stage resources ahead of impact, and prioritize response once the weather clears. The same data layers used for live response also support after-action review, since historical weather data can reconstruct conditions at a specific place and time.
_______________________________________________________________________________
Baron Weather is a global weather intelligence company serving broadcast media, enterprise organizations, and government agencies worldwide. Our solutions span the full spectrum of weather technology — from physical weather radar systems and proprietary weather modeling platforms to real-time data, analytics, and decision-support tools. Whether protecting on-air broadcasts, enabling operational decision-making for large enterprises, or supporting the forecast and warning missions of government agencies and meteorological services around the world, Baron brings together the depth of science and the precision of technology.